A man who knew the Jacks Fork in the 1920s remembered wading out “about hip deep”Jacobson and Primm 1994, 61 (an interviewee recalling the 1920s). and being able to “look down and see your feet on the Bottom. The flat land along a river or creek, built of its deposits and open to its floods. In the 1920s the bottoms near Eminence averaged about a quarter of a mile wide (Chapter 2; Chapter 5). Glossary →, watch the minnows play around.” The Riverways holds 134 miles of such water, and the park is probably one of a handfulVana-Miller 2007, ix, 35 (the park “is probably one of a handful of areas” with such clarity). of places in the continental United States with so much river that clear.
Clear water can still carry bacteria, nutrients and the wastes of towns. Before anyone tested them, the cold springs of the Ozarks were assumed to be “pure.” Fifty years of sampling, a run of bad summers below Eminence and a spill at a sewage plant in Mountain View have since shown how directly the land around the river connects to the water people swim in.
Why the water is clear
Most rivers run muddy because rain washes soil off the land and into the channel. The Jacks Fork escapes much of that in two ways. Springs supply about 60 percentVana-Miller 2007, viii, 35. of the combined flow of the Jacks Fork and the Current, and spring water comes out of the rock already filtered of soil. And in dry weather most small tributaries never reach the river. Their water sinksVana-Miller 2007, 35; see Chapter 12. into gravel and cracks in the Dolomite. Calcium magnesium carbonate rock, a close relative of limestone, formed from lime mud on the floor of a warm, shallow sea. Nearly every bluff on the Jacks Fork is dolomite (Chapter 1). Glossary →, so much of the muddy runoff from a summer shower stays underground (Chapter 12). The watershed is about three-quarters forest, and 92 percent of its farmland is pasture or hayDavis and Barr 2006, 4 (76 percent forest, 23 percent agricultural)..
In the 1970s suspended sediment in the Jacks Fork above Two Rivers averaged 16 milligrams per liter in samples taken between stormsBarks 1978, 27 (Jacks Fork above Two Rivers; no samples were collected during storm runoff)., about half a teaspoon of fine dirt in a bathtub of water. In winter readings taken between 2005 and 2014, turbidity, the cloudiness of water as measured by how much light a sample scattersthe general definition of turbidity, measured in nephelometric turbidity units., was nearly always very lowBowles, Morrison and Cribbs 2018, 72–73 (“nearly always below 10 NTU”; samples taken November to January). on both rivers.
What the water does carry is dissolved rock. Rainwater turned weakly acid by carbon dioxide from the soil dissolves the dolomitesee Chapter 1. as it soaks down through the cracks (Chapter 1), and it comes out of the ground carrying the rock away as calcium, magnesium and bicarbonate. Those three make up more than 90 percentBarks 1978, 1. of what is dissolved in the springs and rivers. Water carrying that much rock is called hard. On the standard scale, which measures hardness as the equivalent weight of calcium carbonate, anything from 121 to 180 milligrams per liter counts as hard and anything above 180 as very hard. Ten samples from the Jacks Fork above Two Rivers in the 1970s averaged 159, and well water in the Riverways, which has probably spent longer in the rock, averaged 259Barks 1978, 12, 19, 37 (spring water less mineralized than well water “presumably because of less exposure to the soluble rocks”; the hardness classes after Brown and others 1970; table 16, ten samples above Two Rivers, 1973–75, mean 159 milligrams per liter as calcium carbonate; 21 well samples, mean 259); MDC 2001, PDF 82, also rates the Jacks Fork hard by the Geological Survey’s definition.. Dissolved rock is invisible. When the Karst. Country shaped by dissolving rock, with caves, springs, sinkholes and losing streams. About 99 percent of the national riverways is karst (Chapter 1; Chapter 12). Glossary → does move soil, it sorts it: the clay and silt are flushed on through, and the heavy Chert. A hard, fine-grained form of silica that forms in nodules and beds inside dolomite and stays behind when the dolomite dissolves. Most Ozark people call it flint. It makes up the river’s gravel and was the stone of the first people’s tools (Chapter 1; Chapter 3). Glossary → gravelVana-Miller 2007, 33; see Chapter 15. stays in the channel, which is why land clearing in this country has filled the river with gravel (Chapter 15).
Fast water, little filtering
The plumbing that keeps the water clear also makes it easy to pollute. Water that soaks slowly through deep soil is filtered along the way, and bacteria and viruses dieVana-Miller 2007, ix. off in the time it takes. In karst much of the water skips that step. After an intense rain, runoff pours into Sinkhole. A hollow in the ground where rock below has dissolved or caved in, through which water drains underground; also called a sink, an American use (Chapter 2; Chapter 12). Glossary → and Losing stream. A creek that gives up its flow to the bedrock and runs dry for long stretches. Jam Up Creek, Pine Hollow and Johnny Hollow are the officially listed losing streams of the watershed (Chapter 12). Glossary → and races through widened cracks to the springs, which respond within hoursBarks 1978, 6., almost as fast as the creeks nearby (Chapter 12). In many Aquifer. A body of rock that holds groundwater and lets it move. Every formation from the Potosi Dolomite up through the Jefferson City and Cotter belongs to one great water-bearing body, the Ozark aquifer (Chapter 12). Glossary → in the United States groundwater creeps a few feet a year. In the park it has been measured moving as much as three miles a day, and the rock holds back littleThornberry-Ehrlich 2016, 43 (after Vana-Miller 2007). of whatever the water carries, so that water lying on the surface one day can be underground the next and coming out of a big spring within a weekVana-Miller 2007, 32 (“typical lateral groundwater movement in many aquifers in the United States is only a few feet per year,” after Aley 1975)..
The water also starts somewhere other than where a map of ridges would suggest. The land that feeds a spring can reach under a ridge into a neighboring watershed, and about half the land that feeds Alley Spring and Blue Spring lies outsideMugel, Richards and Schumacher 2009, 44 (51 percent of the combined Blue and Alley recharge area); see Chapter 12. the Jacks Fork’s surface watershed above Alley (Chapter 12). The park itself is a narrow stripBowles, Morrison and Cribbs 2018, 68 (about 4 percent of the Current River watershed). along the rivers. Nearly all the ground that feeds the springs is farms, woodlots, yards, roads and towns.
The land that feeds the Jacks Fork’s two big springs holds some of the most open land of any spring’s in the Riverways, and the figuresMugel, Richards and Schumacher 2009, 1, 59–63 (table 9); see Chapter 12. are in Chapter 12. Blue Spring’s Recharge area. The land that feeds a spring. It can reach under a ridge into a neighboring watershed, and its underground edge, the groundwater divide, can lie miles from the ridge that divides the streams on the surface (Chapter 12). Glossary → has the most open land for its size, the most ground draining into sinkholes and almost no public landMugel, Richards and Schumacher 2009, 1, 60–63 (0.3 of 56 square miles public)., which may put it among the recharge areas in the park most at riskThornberry-Ehrlich 2016, 44, summarizing Mugel, Richards and Schumacher 2009 (“may be more at risk for contamination or misuse”). of contamination or misuse.
The first measurements
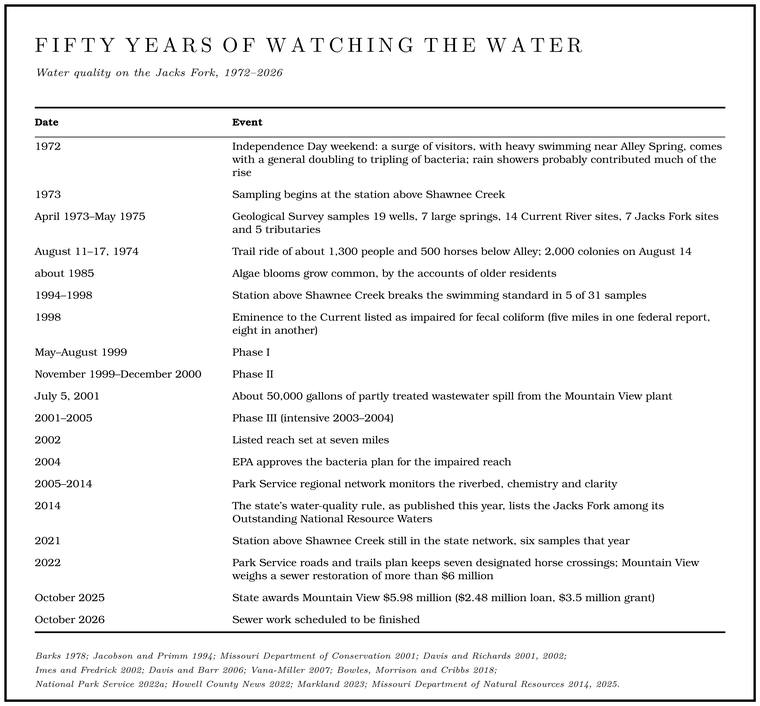
The first thorough look at the Riverways’ water came in the park’s first decade, and in the first months of the Clean Water Act, the amendments to the federal water pollution law that Congress passed over a presidential veto in October 1972Public Law 92-500, enacted October 18, 1972, when Congress overrode the president’s veto.. From April 1973 to May 1975 the Geological Survey sampled 19 wells, 7 large springs, 14 sites on the Current, 7 on the Jacks Fork and 5 tributariesBarks 1978, 1.. Nitrogen and phosphorus were consistently low, at levels that pointed to natural sourcesBarks 1978, 21. such as leaching from soil and rock. The insects, algae and other life of the riverbed showed streams that pollution had barely touched, with nutrients enough for moderate growth of plants and too few for nuisanceBarks 1978, 34, 39 (“basically unaffected by pollution”). growth. Samples from the four main river stations, and one taken during storm runoff, were tested in 1973 and 1974 for about twenty pesticides and for PCBs, and the only ones found were traces of two weed killers, 2,4-D and 2,4,5-T, in the storm sample from the Current below Montauk, probably from herbicide sprayed on timber in the upper watershedBarks 1978, 26 (the compounds tested, about twenty, include those added for July 1974; 0.03 micrograms per liter of each herbicide, in the storm sample of July 23, 1974, “probably caused by spraying herbicides on timber in the upper part of the watershed”)..
Two details showed where the land already mattered. Both concern nitrate, the form most nitrogen takesgeneral chemistry. in water with plenty of oxygen in it, whether it started as fertilizer, manure, sewage or rotting leaves, and a form that passes easily through soil and rock. Springs in the upper White River basin near Springfield, in dairy and stock-raising country, carried about thirteen timesBarks 1978, 15. the nitrate of the Current River basin’s springs. And on the Jacks Fork itself nitrate doubled at Alley, from about 0.2 milligrams per liter above the spring to about 0.4Barks 1978, 21. below it, because the spring water carried more than the river. In a survey of July and August 1973, Alley and Montauk were the only springs in the park that raised the nitrate of the river they entered, and floating, camping on Gravel bar. A bank of chert gravel and sand, usually on the inside of a bend, bare at low water (Chapter 15; Chapter 18). Glossary → and the spreading of farm fertilizer made no detectable differenceBarks 1978, 23..
Bacteria told much the same story. The test of the time counted Fecal coliform. Bacteria of the gut of warm-blooded animals, the older measure of whether feces were in the water. By 2020 Missouri had replaced it with E. coli (Chapter 17). Glossary → bacteria, which live in the guts of warm-blooded animals. Most are harmless themselves, but finding them means feces are in the water, and possibly the germs that travel with feces. To count them, a measured sample of water is drawn through a filter fine enough to catch bacteria, and the filter is laid on a dish of nutrient and kept warm; each bacterium caught on it grows into a spot, a colonyBarks 1978, 9 (the membrane-filter method); the description of the method is general., large enough to see and count. The recommended limit for swimming was 200 coloniesBarks 1978, 29 (after Federal Water Pollution Control Administration 1968). in 100 milliliters of water, a sample a little under half a cup. Thirty samples from the Jacks Fork averaged 57. Routine samplingBarks 1978, 28 (table 19). above and below Eminence, Van Buren and the big campgrounds found no increase that could be pinned on them. The samples were also tested for a second group, the fecal streptococci, since the balance between the two hints at where the feces came from. People pass more coliforms than streptococci, and cattle and horses more streptococci than coliforms. In the Riverways the coliforms generally ran less than six-tenths of the streptococci, which suggested that livestockBarks 1978, 28 (ratios of fecal coliform to fecal streptococcus “generally less than 0.6, indicating that numbers and distribution of livestock probably influence bacteria densities”). influenced the counts.
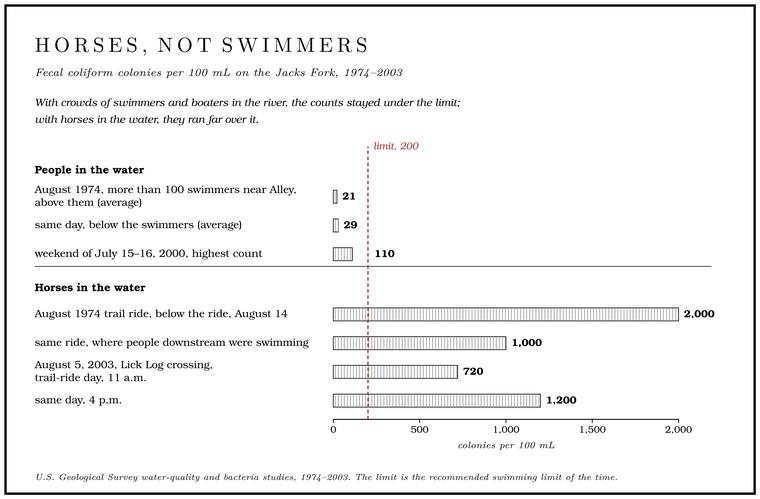
Over the Independence Day weekend of 1972, when a Geological Survey team sampled again and again around Eminence, Van Buren and the big campgrounds, a surge of visitors, with heavy swimming especially near Alley Spring, came with a general doubling to tripling of bacteria, though rain showers probably contributed much of the rise. Counts were also higher on the Jacks Fork where horses were crossingBarks 1978, 29–30 (summarizing Maxwell 1974). and recrossing the river during a Trail ride. An organized gathering of hundreds or thousands of horseback riders, camping for several days and riding the trails and river crossings. The trail rides grew into a large business on the lower Jacks Fork (Chapter 11). Glossary →. On a heavy-use day in August 1974Barks 1978, 28–29., with more than a hundred swimmers in the river near the Alley campground, fecal coliform averaged 21 colonies above them and 29 below.
From August 11 to 17, 1974, a cross-country trail ride with about 1,300 people and 500 horses centered on a mile of the Jacks Fork about a mile and a half below Alley Spring. Above the ride the counts stayed low. Below it they reached 2,000 colonies on August 14, ten times the limit, and on the days sampled they peaked at midmorning, when the most horses were in the water. The low share of coliforms to streptococciBarks 1978, 29. pointed to animal wastes. People downstream were seen swimming, bathing and brushing their teeth in water that held 1,000. By the time the water reached Eminence, about four milesBarks 1978, 29–30 (fig. 7; the midmorning peak is from the August 14 and 16 samples, graphed for August 16). down, most of the bacteria had died.
The bacteria years
Two decades later the finding returned on a larger scale. Trail riding grew on the lower Jacks Forksee Chapters 10 and 11. through the 1980s and 1990s (Chapter 11). The largest facility, on private land in the gapsee Chapter 11. in park ownership around Eminence, had by the early 2000s supported an estimated 3,000 horses on week-long rides held at least seven weeksDavis and Barr 2006, 3. a year. Riders camped, rode the ridges and bottoms, and crossed the river again and again at a few heavily used Ford. A place where a road crosses through the water. Many of the river’s fords took the names of the families who lived beside them (Chapter 8). Glossary →.
The long-running sampling station above Shawnee Creek broke the swimming standard in 5 of 31 samples between 1994 and 1998, all in the recreation seasonMDC 2001, PDF 82.. In 1998 Missouri put the last stretch of the Jacks Fork, from Eminence to the Current, on its federal list of Impaired water. A stream on the list the state keeps under the federal Clean Water Act of waters that fail a standard. The Jacks Fork below Eminence was listed for fecal bacteria in 1998 (Chapter 17). Glossary → for fecal coliform; the stretch is given as five milesDavis and Richards 2001, [2]; Davis and Barr 2006, 1; MDC 2001, PDF 85. and as eightDavis and Richards 2002, 1.. In 2002 the listed reach was set at seven milesDavis and Barr 2006, 1; Vana-Miller 2007, 15.. The list comes from the federal Clean Water Act. Each state names the streams that fail its standards even with the pollution controls already in place, and for each one it must set a total maximum daily load, the most of the pollutant the stream can carry and still meet its standard, shared out among the sourcesDavis and Barr 2006, 2. that put it there. Sharing it out meant finding the sources.
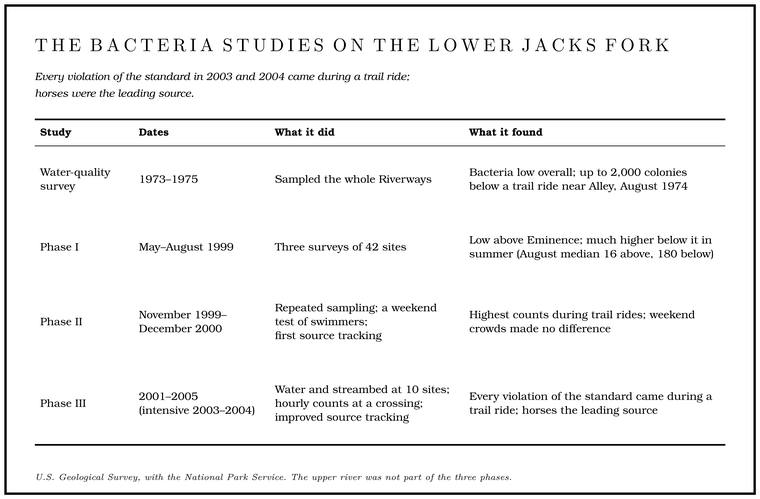
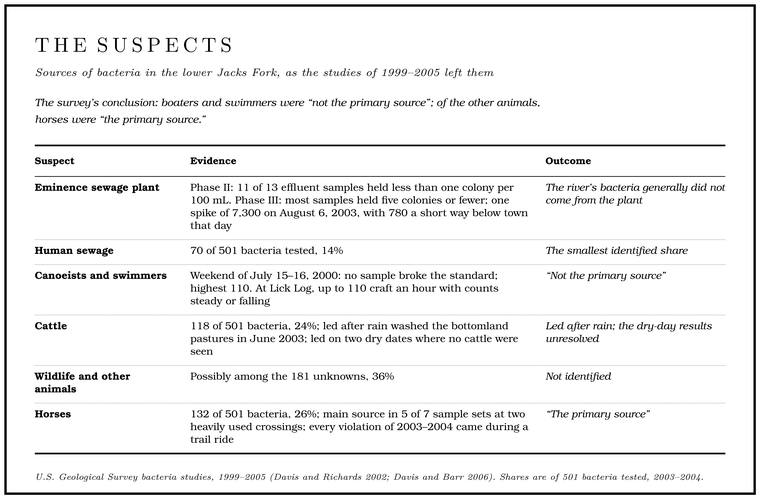
The suspectsDavis and Barr 2006, 1. were the Eminence sewage plant, pit toilets and septic systems at campgrounds, canoeists and swimmers, cattle on the bottomland pastures, wildlife and horses. Working with the Park Service, the Geological Survey sorted them out in three phases between Alley Spring and the mouth (Table 17.1). The upper river was not part of the work, and the findings belong to the lower Jacks Fork.
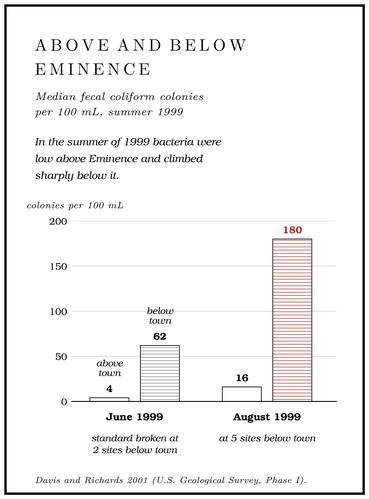
Phase I mapped the problem. In the summer of 1999 bacteria were low above Eminence and climbed sharply below it. In June the median count above town, the middle value when the samples are put in order, was 4 colonies and below it 62; in August, 16 and 180. The standard was broken at two sites below Eminence in June and at five in August. Alley Spring aside, the tributariesDavis and Richards 2001, [4], [5] (medians and tributaries on [4]; exceedances at sites 95 and 110 in June and at 95, 110, 140, 150 and 165 in August on [5]; the fact sheet’s [3] is a foldout map); Davis and Barr 2006, 5. carried too little water to change the river much.
Phase II went looking for causes. Six guided week-long trail rides were held on the lower river in 2000, and the highest counts not tied to rain came during the August ride, when the river was lowest and warmest and every kind of use was at its peak. Counts were also high during the May and October rides, when few canoes and no swimmersDavis and Richards 2002, 4–5, 20. or tubers were on the river. The Eminence sewage plant did not look like the source. Of 13 samplesDavis and Richards 2002, 20. of its effluent, 11 held less than one colony per 100 milliliters.
The floaters were tested directly over the weekend of July 15 and 16, 2000, at the height of the season, with six sites sampled five or six times each. Not one sample broke the standard. The highest count, 110 colonies, came at the crossing above Lick Log Hollow, possibly from a herd of cows kept in the pasture beside the river, though none were seen crossingDavis and Richards 2002, 21, 27 (the elevated counts “may be because of the herd of cows that resides in the pasture adjoining the river, although the cows were not observed crossing the river during sampling”).. The crowds of swimmers, canoeists and tubers did not appear to affect the bacteria.
The streambed was sampled too. Fecal bacteria survive a few hours to a few days in river water and a few weeks to a few monthsDavis and Richards 2002, 15. in the sand and silt of the bed. At the Lick Log crossing, bacteria in both the bed and the water rose once a ride began. There are four waysDavis and Richards 2002, 27. that could happen: hooves stirring up bacteria stored in the bed, manure dropped straight into the water, manure carried in on the animals’ feet, and sewage leaking from some unknown source.
Phase III settled most of it. Through the summers and early falls of 2003 and 2004 ten sites were sampled, mostly in dry weather. The standard was broken five times, at two sites on August 6, 2003, at one on October 8, 2003, and at two on August 11, 2004, and every one of those samples was taken during a trail ride. On weekdays and weekends without a ride the standard was never exceeded. The three sitesDavis and Barr 2006, 1, 12, 30. with the most trail riding had the highest counts.
The Lick Log crossing got the closest look. The site has a large gravel bar where boaters and swimmers stop to picnic and often swim, and it is also an intensely used trail-ride crossing, outside the park boundary. Samplers stood on the bar from about 8 a.m. to 5 p.m., took a sample every hour and counted what went by. On weekends, as the canoes, kayaks and tubes increased to as many as 110 an hour, the bacteria held steady or fell. On trail-ride days as many as 500 horses an hour crossed, and on October 7, 2003, and August 10, 2004, the bacteria rose and fell with the number of horses in the water (Fig. 17.1after Davis and Barr 2006, figs. 8–11.). On August 5, 2003, the counts climbed all day, to 720 colonies at 11 a.m. and 1,200Davis and Barr 2006, 12, 17 (“a large gravel bar where boaters and swimmers tend to stop, picnic, and oftentimes swim”). at 4 p.m., even after the crossings thinned in the afternoon.
One other spike stood out. On August 6, 2003, the Eminence plant’s effluent tested at 7,300 colonies, and a site a short way below town read 780 that day, probably because of it. Most of the plant’s samples held five colonies or fewer, and the river’s bacteria generally did not come from the plantDavis and Barr 2006, 12, 26, 30..
Whose bacteria
The last question was whose feces were in the water, and it was answered by Source tracking. Matching the strains of E. coli in the water to the animals or sewage they came from (Chapter 17). Glossary →. The bacterium E. coli lives in the gut of every warm-blooded animal, and the strains that live in a cow differ slightly from those in a horse or a person. A laboratory grows E. coli from a water sample, copies stretches of each bacterium’s DNA and spreads the copies out in a gel, where they sort themselves by size into a pattern of bands, something like a bar codethe general method of DNA fingerprinting.. Match enough patterns from the river against a library of patterns from known sources, and the result is a rough census of who has been in the water.
The library came from sewage (the Eminence plant, the small plant at the Alley Spring campground and the pit toilets at Shawnee Creek), from four cattle herds in the basin, and from trail-ride horses, most of which probably lived outside the basinDavis and Barr 2006, 9.. Between August 2002 and March 2005 it grew to about 660 patterns, 215 from sewage, 229 from cattle and 215 from horses. A bacterium from the river was put down to a source only if its pattern was at least 80 percent similarDavis and Barr 2006, 9 (rep-PCR DNA fingerprinting; library isolates collected in the basin, August 2002 to March 2005). to one in the library, and otherwise it counted as unknown. Phase II’s first attempt, by a different method then considered experimental and against a library drawn from university farms and other places as well as the Eminence area, had put 40 percent of its 65 bacteria from the water down to sewage, 29 percent to horses and 11 percentDavis and Richards 2002, 1–2, 27–29 (ribotyping; of 65 isolates from water, 26 sewage, 19 horse, 7 cow and 13 unknown, matched against isolates from University of Missouri veterinary farms, selected places in southwest Missouri and the Eminence area); Davis and Barr 2006, 22. to cattle. Phase III’s better method and larger library classified known samples correctly 85 to 94 percentDavis and Barr 2006, 23. of the time (Table 17.2). Neither is exact. Strains vary from place to place and year to year within one kind of animal, and animals that share a pasture can share a strainDavis and Barr 2006, 9; Davis and Richards 2002, 27..
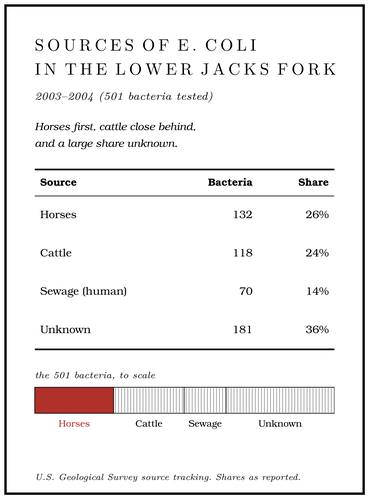
The unknowns could be pigs, dogs, cats, chickens, deer, raccoons, geese, ducksDavis and Barr 2006, 11., or horses whose strains were not in the library. Horses were the main source in five of the seven sample sets taken at two heavily usedDavis and Barr 2006, 26. trail-ride crossings.
The cattle numbers held a puzzle. About 22,000 headDavis and Barr 2006, 4. of cattle grazed in the Jacks Fork basin in 2002, and after rain washed the bottomland pastures in June 2003 cattle patterns led the count. On two dry-weather dates, though, cattle patterns came out on top at sites where no cattle were seen grazing near the river. One possible sourceDavis and Barr 2006, 26, 30 (August 6, 2003, and October 5, 2004; the riverbed is the survey’s suggestion). is the riverbed itself: bacteria from earlier runoff settle into the bed and survive there for weeksDavis and Richards 2002, 15., and horses wading across could stir the old deposit back up. Storage in the bed cannot always explain the high counts during rides, though, and the streambed results were inconclusiveDavis and Barr 2006, 17, 22..
Boaters and swimmers were not the main source of the fecal bacteria in the lower Jacks Fork. The bacteria came from other animals, and above all from horsesDavis and Barr 2006, 1; see also 30 (“recreational users (including boaters and swimmers) are not the primary source of fecal coliform bacteria in the Jacks Fork; rather, the presence of fecal coliform bacteria is associated with other animals, of which horses are the primary source”)..
Green holes
In interviews in the early 1990s many older people along the Jacks Fork described algae blooms growing common from about 1985Jacobson and Primm 1994, 61 (interviews of about 1991–93). on. One man described his last float below the Highway 17 bridge: “Mossy and green. Looks different. It used to be clear.” The green ran from the bridge “to way below Blue Spring. Most of them Hole. Any pool deep enough to swim or fish in, named or not, the basic unit of the river in local speech; also “hole of water” (Chapter 18). Glossary → was greenish, mossy or something.” The man who had watched the minnows around his feet in the 1920s said the rocks used to be white, and “Now when you go down there they’re green with slime on them.” A third remembered gravel “just as clean as it could be,” and called the river now “a nasty and dirty old slimey river.”
The angler whose views on the fishing appear in Chapter 16 described “huge algae blooms” on both Prong. A branch or arm of a creek, set down in 1860 as Southern usage. The North and South Prongs join to form the Jacks Fork (Chapter 18). Glossary →, starting in late July, so thick that when they died and floated up “you just can’t fish.” They faded out below the prongs, he said, and “were not there 20 years ago.” Along the Jacks Fork the people interviewed generally agreedJacobson and Primm 1994, 61, 63. that blooms were much more common than in the past.
Algae need light, warmth and nutrients, chiefly nitrogen and phosphorus, and they use the two in a fairly steady proportion, about sixteen atoms of nitrogen to one of phosphorus. Whichever runs short first sets the limit on how much can grow. In the Riverways the proportions in the water suggest that phosphorus is the one in shortest supplyVana-Miller 2007, 15, 36., which fits the poor soils of the watershed. In a river limited by phosphorus, added nitrogen may make little difference, while a small increase in phosphorusVana-Miller 2007, 36 (phosphorus limits algal growth where the N:P ratio exceeds 16; low phosphorus “not surprising given the infertile soils”; park waters “may be sensitive to small increases in P”). could set off nuisance blooms. Nutrients reach the river from pasture runoff and manure, from septic systems, from soil washed off cleared ground and from sewage plants. As of 2007 none of the five municipal plantsVana-Miller 2007, xi. discharging into the park’s watersheds treated for nitrogen or phosphorus. The same angler described land in the headwaters cleared of every tree on slopes as steep as one to oneJacobson and Primm 1994, 50., a foot of rise for every foot acrossgeneral., “particularly on the South Prong.” How much of the prongs’ streamside timbersee Chapter 15. was gone by 2001 is told in Chapter 15.
No one measured the upper river’s nutrients during the blooms people described, and what fed them has not been settled. Park water samples taken from 1973 to 1998 and analyzed in 2002 hinted at rising nitrogen and phosphorus at one site on the upper river, though the trend was not statistically significant, and chlorophyllVana-Miller 2007, 36 (after Raymond and Vache 2002, an analysis of data of 1973–98, and NPS 2005; the upper Jacks Fork trend judged “based on visual inspections of scatter plots”)., a measure of how much algae is in the water, was generally rising along the Jacks Fork. Below Alley, where measurements were taken in 1999 and 2000, phosphorus rose immediately below the Eminence sewage plant and fell back quickly downstream. Otherwise nutrients shifted with the seasons, the time of day and the weather, and recreationDavis and Richards 2002, 2. made no measurable difference. Alley Spring still carried more nitrate than the river, as it had in 1973, and dissolved ammonia, which can be toxic to Mussel. A freshwater clam that lives half-buried in the riverbed and filters its food from the water. Mussels on the Jacks Fork fell sharply between the surveys of 1982 and 2017–19 (Chapter 16). Glossary → (Chapter 16), did not differ significantlyDavis and Richards 2002, 34 (Alley Spring median nitrite plus nitrate 0.58 milligrams per liter); see Chapter 16. from site to site. Park samples generally held less phosphorus than a benchmarkVana-Miller 2007, 15 (0.068 milligrams per liter). the federal Environmental Protection Agency was then considering for the region. At three stations on the upper river, monitoring from 2005 to 2014 found aquatic plants and filamentous algae together covering less than 11 percent of the Riffle. A fast, shallow, rocky stretch between pools. The riffles are the gardens of the riverbed: in July a square meter of riffle produced more than six times as much as a square meter of pool (Chapter 16). Glossary → bed, and insect communities that rated unimpaired (Chapter 16). Those samples were taken between November and early JanuaryBowles, Morrison and Cribbs 2018, 67, 69, 71–73; see Chapter 16., outside the season of the blooms.
The spill at Mountain View
Mountain View sits on the divide between the Jacks Fork and the Eleven Point, at the head of Jam Up Creeksee Chapter 12.. In 1994 the town’s treatment plant was discharging about a quarter of a million gallonsMDC 2001, PDF 83 (0.250 million gallons a day, 1994). a day into the creek, which loses all its surface flow within half a mile to a mile below the plant. Dye trace. A test of where underground water goes: a harmless fluorescent dye is put into a sinking stream or a sinkhole, and the springs are watched for it. Traces showed water lost from Jam Up Creek reaching Big Spring on the Current (Chapter 12). Glossary → had shown that the lost water travels underground to Big Spring on the Current River, about thirty-eight milesImes and Fredrick 2002; see Chapter 12. away (Chapter 12).
On July 5, 2001, about 50,000 gallons of wastewater spilled from the plant into the creek. It is described both as partially treatedImes and Fredrick 2002 (“partially treated”). and as untreated sewageVana-Miller 2007, 33, 38.. A dye trace begun five days later followed the water to Big Spring, where it surfaced in August and peaked on August 21Imes and Fredrick 2002; see Chapter 12. (Chapter 12).
The creek showed what the water carried. A sample taken on July 12 about 1,200 feet below the plant held 35 of 67 compounds associated with wastewater. Among those found in higher amounts were coprostanol, a compound from human and carnivore feces; caffeine; cholesterol; the insect repellent DEET; and two compounds from detergents. A sample from Big Spring on July 10, before the wastewater could arrive, held none of the 67. A second, on August 17, held two, phenol and cholesterol, and both could have come from other sources: phenol is used in disinfectants for toilets, and a public toilet stood near the spring, while cholesterol is present in animal waste. That day Big Spring was discharging about 196 million gallons, 3,900 times the volume of the spill. Whatever arrived from Mountain View was diluted below what the laboratory could measureImes and Fredrick 2002, “Effect of Wastewater on Water Quality at Big Spring” and table 1..
The spill did no detectable harm at the spring, probably because of Big Spring’s size. Had the same accident happened in the recharge area of a smaller spring, with less water to dilute it, the result could have been severe ecological damage in the Spring branch. The stream that runs from a spring to the river, such as the branch below Alley Spring (Reach H). Glossary → and the river, and a threat to public healthVana-Miller 2007, 33 (the report credits the spring’s size; “severe ecological damage and public health threats could have occurred”)..
Mountain View’s sewer system remained a concern. In 2022 the city was weighing a sewer restoration expected to cost more than $6 millionHowell County News 2022., and in October 2025 the state awarded it $5.98 million, a $2.48 million loan and a $3.5 million grant from the Clean Water State Revolving Fund, to rehabilitate its collection system and reduce sewer overflows. The work was scheduled to be finished in October 2026MDNR 2025..
Wells, septic tanks and sinkholes
Typhoid fever, a disease spread by water or food fouled with the waste of an infected personthe general epidemiology of typhoid fever., was in the valley long before the tests. Among the deaths reported in and around Eminence from July 1879 to June 1880 was a month-old child’s from typhoid, and the deaths reported for Delaware Township in 1880 included a young man of twenty-three, dead of it in AprilLewis 1980, PDF pp. 61 (deaths reported in Delaware Township in 1880), 68 (deaths “in and adjacent to Eminence,” July 1879 to June 1880), the only source; names withheld..
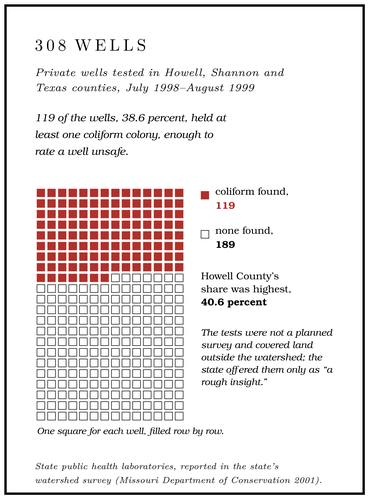
Most people in the Jacks Fork country drink untreated water from private wells, and the karst that carried Mountain View’s spill to Big Spring carries other waste to wells. Between July 1998 and August 1999 the state public health laboratories tested water from 308 wells in Howell, Shannon and Texas counties, and 119 of them, 38.6 percent, held at least one coliform colony, enough to rate a well unsafe, since any coliform at allMDC 2001, PDF 83 (a well “is considered unsafe if any coliform colonies result from the sample”); the reading of a coliform as a sign of a path from the surface is general. is a sign that water from the surface may be reaching the well. Howell County’s share was highest, at 40.6 percent. The tests were not a planned survey and covered all three counties, including land outside the watershed, so they give only a rough ideaMDC 2001, PDF 83 (“a rough insight”). of the groundwater in the area.
Septic systems are the main way the countryside disposes of its sewage. A septic tank holds back the solids, and the liquid runs out into a drain fieldgeneral., where the soil is meant to filter it and break it down before it reaches the groundwater. In thin, stony soil over creviced dolomite the liquid can reach the cracks before the soil has done that work. At about 100 gallons of sewage per person per day, and leaving out the two towns on sewer systems, the watershed generates an estimated 410,000MDC 2001, PDF 84 (410,300 gallons, after Aley and Aley 1987 and a 1972 state figure). gallons of septic effluent a day. The scattered pattern of settlement in the Riverways country has probably helped a great deal, and the trouble has centered on places where people live close togetherMDC 2001, PDF 84, quoting Aley and Aley 1987, a groundwater study for the park (the “dispersed pattern of settlement in the study region is of great help in reducing groundwater contamination problems resulting from sewage disposal”; problems are “centered on areas with concentrated settlement”).. Sinkholes and caves in the region were long used as garbage dumps, and some sinkholes became outlets for septic systemsThornberry-Ehrlich 2016, 41; see Chapter 13. (Chapter 13).
Other openings lead down too. In the late 1990s the watershed had 13 active mines, all of them gravel operations or Limestone. Calcium carbonate rock formed from lime mud and shells on a sea floor. Most of the limestone laid down here later became dolomite (Chapter 1). Glossary → quarries, and 22 past producers, the largest share of them copper and iron mines. Nearly all were surfaceMDC 2001, PDF 83. pits, open holes that can link the surface to the groundwater (Chapter 15). Traces of farm herbicides, among them atrazine, a weed killer used mostly on corn and sorghumgeneral., and its Breakdown. The falling of slabs from a cave’s ceiling and walls along their joints once a passage drains and the rock bears its full weight. Breakdown made much of Jam Up Cave’s river entrance (Chapter 13). Glossary → product, turned up in two of four samples taken from the Jacks Fork in 1994 and 1995 for the Geological Survey’s national water-quality assessment, which sampled the Ozark Plateaus as one of its study units. A single groundwater sample from the watershed, taken in 1993, held none. Across the whole study unit, pesticides were found at 39 of 43 surface-water sites, six or more of them in some samples at 18 sites, and at 73 of 215MDC 2001, PDF 82 (deethylatrazine, thiobencarb, atrazine and metolachlor; the Pesticides National Synthesis Project of the National Water-Quality Assessment Program, after Bell and others 1997 and Adamski 1996). groundwater sites. In the 1990s the state recorded seven water-pollution incidents in the watershed, high fecal coliform counts most often among them, and no known fish killsMDC 2001, PDF 85 (table Wq04, impacts since 1990)..
The quantity of water has its own law. Missouri follows riparian water law (Chapter 12): everyone whose land touches or lies above a water source may make reasonable use of it, so long as other users are not unduly harmed. No state law sets how much anyone may take. A user able to withdraw 100,000 gallons a day or more must register once and reportMDNR 2018; see Chapter 12. its use each year. In 1997 Mountain View drew about 147 million gallons of groundwater and Eminence about 40 millionMDC 2001, PDF 86..
What protects the river
The state’s highest classification. Missouri lists three Outstanding National Resource Waters: the Current River from the northern Ripley County line to its headwaters, the Eleven Point above Highway 142, and the Jacks Fork for 46.5 miles upstream from its mouth, into Texas County. The list is part of the state’s water-quality rule as published in 2014MDNR, “Outstanding National Resource Waters” (the layer gives the Jacks Fork as “Mouth to Headwaters,” Shannon County to Texas County, with its upper end in Sec. 29, T28N, R7W).. Under the federal rules for keeping clean water clean, a state sorts its waters into tiers. In every water the existing uses must be protected. Where a water is better than its standards, some of that margin may be given up, but only for an important social or economic reason and after public noticethe federal antidegradation rule, 40 C.F.R. § 131.12 (tier I, existing uses; tier II, high-quality waters, lowered only where necessary for important economic or social development after public participation; tier III, Outstanding National Resource Waters, maintained and protected).. The outstanding waters, Tier III, may not be allowed to declineVana-Miller 2007, 14; Davis and Barr 2006, 2. measurablyDavis and Barr 2006, 2 (Missouri’s tier III policy “allows no measurable increases in pollutant loading”)., so that in practice the river’s natural condition becomes its standard. The state also assigns each water its uses, each with criteria meant to protect it, and in 2007 those for the Jacks Fork in the park were livestock and wildlife watering, warm-water aquatic life, human health through the eating of fish, a cool-water fishery, whole-body-contact recreation, and boating and canoeingVana-Miller 2007, 14 (table 4).. The bacteria plan for the impaired reach, approved by the federal Environmental Protection Agency on January 21, 2004MDNR 2020 (fact sheet)., set its target at natural background: no more than 25 fecal coliform colonies per 100 milliliters as a 30-day geometric mean, which takes at least four evenly spaced samplesDavis and Barr 2006, 11. to figure, and no single sample above 200Davis and Barr 2006, 2–3; Vana-Miller 2007, 15.. The plan took the Eminence plant’s low counts as they were, and assumed that, the river being Tier III water, the plant would go on discharging effluent that cleanMDNR 2020 (the plan found the plant had kept “relatively low bacteria counts in their effluents”; “Since Jacks Fork is a Tier III Outstanding Resource Water, continued maintenance of these high quality effluent discharges is assumed in this TMDL”)..
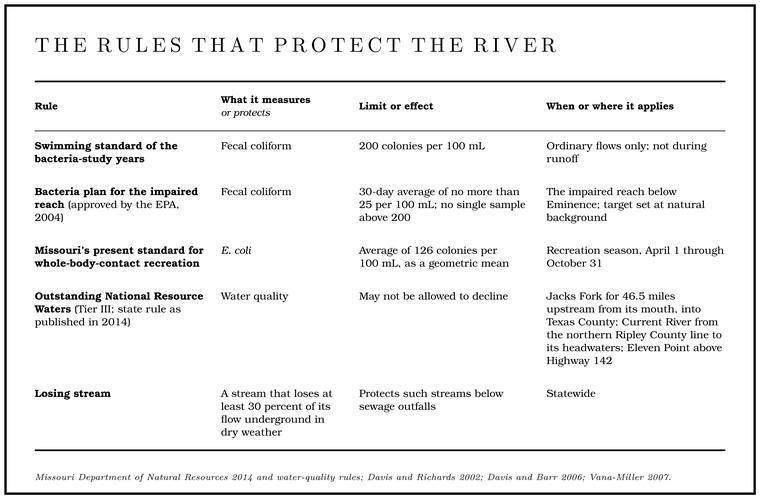
Bacteria standards. Missouri now measures swimming-water bacteria as E. coli, a change the federal Environmental Protection Agency approved in May 2006EPA 2006 (among the provisions approved, the “Adoption of E. coli bacteria criteria for the protection of recreational uses”)., and by 2020 the state no longer used fecal coliform at allMDNR 2020 (fact sheet: “Fecal Coliform is no longer the bacterial parameter used by the Department, as E. coli is now used”).. Its standard for whole-body-contact recreation is an average of 126 colonies per 100 milliliters, figured as a geometric mean over the recreation season of April 1 through October 31MDNR 2014.. A geometric mean keeps one very high reading from swamping the rest. Three samples of 10, 100 and 1,000 colonies average 370 the ordinary way and 100 as a geometric mean, found by multiplying the three together and taking the cube rootarithmetic.. In the years of the bacteria studies the standard applied to the Jacks Fork only at ordinary flowsDavis and Richards 2002, 3; Davis and Barr 2006, 2.. During runoff, when counts ran highest, it did not apply at all.
Sewage in karst. Missouri defines a losing stream as one that loses at least 30 percentMDNR, “Losing Streams”; see Chapter 12. of its flow underground in dry weather (Chapter 12), and the designation exists to protect such streams below sewage outfalls. In 1998 the watershed had five discharge permitsMDC 2001, PDF 83, 94 (table Wq03).: the Mountain View and Eminence sewage plants, a Park Service plant on the Jacks Fork that spread its effluent on land, a landfill near Willow Springs on a tributary of Pine Creek, and a sludge hauler on Little Shawnee Creek.
The park’s own sewage went onto land. In the middle 1970s spray-irrigation plants were built at the three busiest recreation areas, Alley Spring, Round Spring and Big Spring, to begin work in 1976. Each was to spray its treated liquid over grass or woods about half a mile from the river and between a fifth of a mile and two miles from the area’s main spring and its new well. The new well at Alley, drilled in 1970, went down 650 feet and was cased for the first 301Barks 1978, 11–12 (table 1, well 18).. The groundwater of the 1970s was judged to be of good quality, though the wells near the three spray fields were thought worth watchingBarks 1978, 37 (“it would be useful to monitor ground-water quality in areas of new development, such as the three new spray-irrigation sewage-treatment sites”)..
The Eminence plant. The town’s sewage plant discharges straight to the river. Under its state permit of 2020 it was a tertiary plant, one that adds a third Stage. The height of the water surface above a gauge’s datum, the reading a gauge records. A stage differs from the depth of the water. At Eminence the datum stands 616.18 feet above sea level (Chapter 14). Glossary → of cleaning to the usual settling and biological treatment. After screening and the removal of grit, the sewage is stirred and aired in an oxidation ditch, an oval channel where bacteria break the waste down, and settled again in two clarifiers. Then it runs through three sand filters and passes under ultraviolet light, which kills most of the bacteriathe general working of tertiary plants, oxidation ditches and ultraviolet disinfection. left in it, before it goes to the river. The plant was designed for 292,000 gallons a day and was handling about 239,000. Through the swimming season its effluent was to average no more than 126 E. coli colonies per 100 milliliters over a month, the river’s own swimming standard, and 630 over a week, limits carried over from its earlier permit and judged consistent with the 2004 bacteria plan. The plant was to test its effluent for phosphorus and nitrogen every quarter, but the permit set no limitMDNR 2020 (permit MO-0055328 and fact sheet, which gives the treatment as “Tertiary”; receiving water the Jacks Fork, classified segment 2681, at no distance; effective June 1, 2020). on either.
Horses and crossings. The Park Service’s 2022 roads and trails plan keeps the seven existing designated horse-trail river crossings and calls for closing and restoring the undesignated ones, partly for the sake of water qualityNPS 2022a, 3–4, 15; NPS 2022c; see Chapters 8 and 11. (Chapters 8 and 11). The crossing above Lick Log Hollow, the most closely studied in the bacteria work, lay outside the park boundaryDavis and Barr 2006, 12; Davis and Richards 2002, 21. at the time of the study. The rules themselves are in Part Six.
Watching the river. Water in the watershed has been sampled since the 1960s by five agencies, the federal Environmental Protection Agency, the state’s departments of conservation and of natural resources, the Park Service and the Geological Survey, and volunteer Stream TeamsMDC 2001, PDF 81. have gathered data of their own. The station above Shawnee Creek has been sampled since 1973MDC 2001, PDF 82., and it remained in the state’s ambient monitoring network in 2021, with six samplesMarkland 2023, table 1. that year. Phase III set up sites for long-term bacteria monitoringDavis and Richards 2001, [2]; Vana-Miller 2007, 15., and from 2005 to 2014Bowles, Morrison and Cribbs 2018, 67. the Park Service’s regional network tracked the life of the riverbed, its chemistry and its clarity. Through the early 2000s most sampling ran only in the recreation seasonVana-Miller 2007, x, 36., which leaves the rest of the year thinly recorded.
Land. Most of the ground that feeds the river is private. No livestock counts existed for the watershed itself in 2001. Keeping livestock out of the streamside corridor is an effective wayMDC 2001, PDF 84–85. to protect both surface water and groundwater. The state’s goal for wider wooded corridorssee Chapter 15. along the streams is described in Chapter 15, and among the places ranked highest for that work were Jam Up Creek and the river’s drainage units around Shawnee Creek and Barn HollowMDC 2001, PDF 149.. Logging has mattered less. In places erosion from logging roads and skid trails on rough ground was adding sediment to the springs, but in the late 1980s logging was not counted among the pollution hazardsMDC 2001, PDF 84, quoting Aley and Aley 1987 (forestry not “significant enough to be designated … as a hazard area”; erosion “related primarily to logging roads and skid trails in rugged terrain,” so that logging “undoubtedly contributes to the sediment load of the springs in the Riverways”). of the country that feeds them. Land clearing, mining and the sediment and nutrients they bring, along with other discharges, are probably the greatest long-term threatThornberry-Ehrlich 2016, 44 (after Bowles and others 2011; the park’s geologists’ ranking). to Ozark springs.
After rain
A storm washes manure off pastures and roads into the tributaries, flushes sinkholes into the springs and churns up bacteria stored in the riverbed. After heavy rain on May 5, 1999Davis and Richards 2001, [4]., Alley Spring itself was still sending bacteria into the river five days later. On May 25, 2000, after an evening and night of rain, two sites near the mouth read 450 and 490Davis and Richards 2002, 15. colonies. In June 2003 runoff samples reached more than 600Davis and Barr 2006, 12.. After about two and a half inches of rain near Montauk in July 1973, the upper Current carried about 4,000 fecal coliform colonies per 100 milliliters, twenty times the limit, and a week laterBarks 1978, 28. counts at most sites were still above average. The swimming standard of the bacteria-study years did not apply in such conditionsDavis and Barr 2006, 2..
The state health department advises against swimming or playing in natural waters immediately after a heavy rain, against swallowing river water, against swimming with open sores, and against swimming where livestockMDHSS 2013. or other animals often go. On the Jacks Fork the easiest warning is a river running high and colored, or a rising Gauge. A station of the Geological Survey that records the river’s stage, from which its flow is figured. The Jacks Fork has gauges at Highway 17, Alley and Eminence (Chapter 14). Glossary → at Highway 17see Chapter 14., Alley or Eminence (Chapter 14). Wading, swimming and fishing are not allowed in the park’s springsThornberry-Ehrlich 2016, 44; see Part Six. and spring branches, the habitat most easily damaged (Part Six).