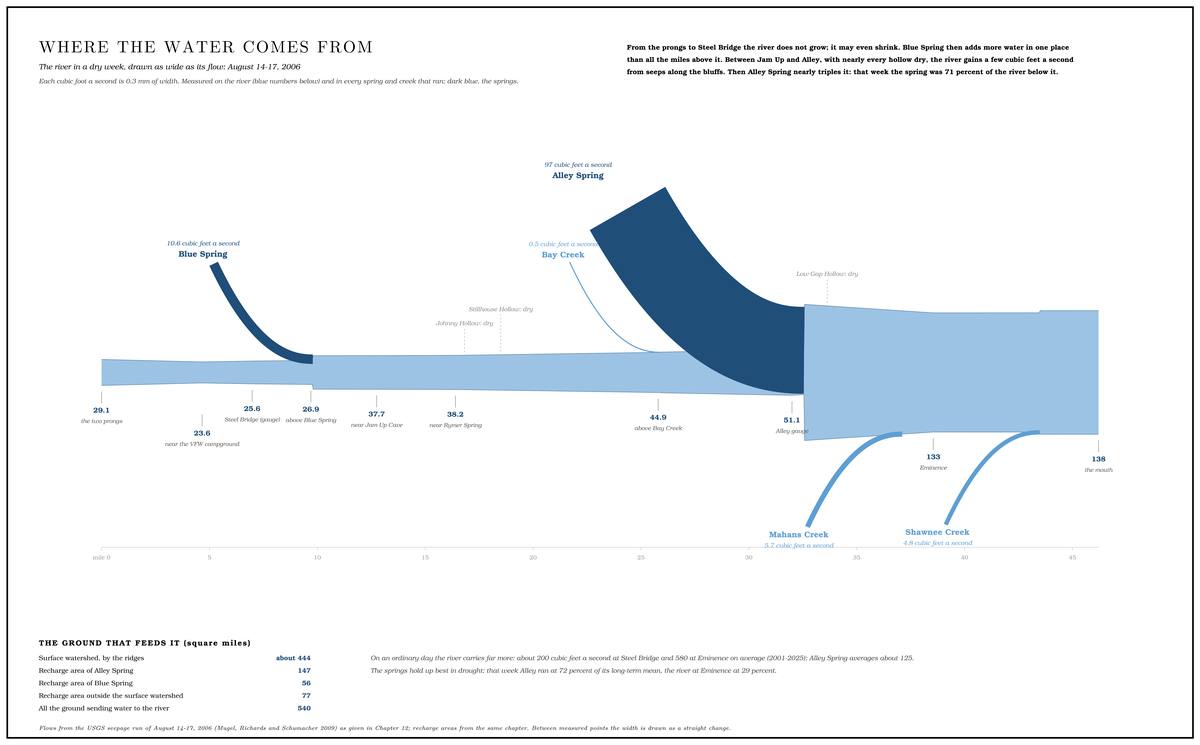
In the middle of August 2006, in a spell of Low Water. The local name for the Highway Y bridge over the South Prong, the access beside it and the county’s low-water crossing where the prongs meet, and so for the head of the river (Chapter 8; Chapter 18). Glossary →Mugel, Richards and Schumacher 2009, 17., crews from the U.S. Geological Survey worked along the Jacks Fork from the Prongs to the mouth with current meters and wading rods. Over four days they measured the flow of the river at dozens of points and in the springs and creeksMugel, Richards and Schumacher 2009, 17, 27–28. that fed it, along with a good many hollows that had no water at all.
At Steel Bridge on August 15 the river was carrying 25.6 cubic feet of water a second, a little under 200 gallons25.6 cubic feet × 7.48 gallons.. At the mouth two days laterMugel, Richards and Schumacher 2009, 27–28 (table 2)., some thirty-nine river milesmeasured along the river centerline (Steel Bridge 6.98, the mouth 46.21); Mugel, Richards and Schumacher 2009, 28 (table 2), puts the Steel Bridge gauge at river mile 38.5 above the mouth. downstream and about 260 feet lowerthe river profile measured on the 2021–23 riverbed survey (Heimann, Atkinson and High 2025; Map 12); see Chapter 2. (Chapter 2), it was carrying 138. Only about an eighththe measured tributaries between Steel Bridge and the mouth total about 14 to 15 cubic feet a second of the 112 gained. of the difference came down the creeks. Johnny Hollow, Low Gap Hollow and the Stillhouse Hollow below Bunker Hill were dry. Bay Creek added half a cubic foot a second, Mahans Creek less than six and Shawnee Creek less than five. The river grew anyway, and it grew in jumps: by about eleven cubic feet a second at Blue Spring and by ninety-seven at AlleyMugel, Richards and Schumacher 2009, 27–28 (table 2). The report’s Stillhouse Hollow, at its river mile 28.4, half a mile below Johnny Hollow, is the Stillhouse Hollow below Bunker Hill, which kept the name in 2011 (USGS GNIS 727108); see Reach F and Chapter 18..
The water was coming up from below. Nearly all the bedrock of the Jacks Fork country is Dolomite. Calcium magnesium carbonate rock, a close relative of limestone, formed from lime mud on the floor of a warm, shallow sea. Nearly every bluff on the Jacks Fork is dolomite (Chapter 1). Glossary →, a rock that slowly dissolves in rainwater, and about 99 percent of the national riverways is Karst. Country shaped by dissolving rock, with caves, springs, sinkholes and losing streams. About 99 percent of the national riverways is karst (Chapter 1; Chapter 12). Glossary →Thornberry-Ehrlich 2016, 12., the name for country shaped by dissolving rock (Chapter 1). How the dissolving makes caves is told in Chapter 13. Where the water goes into the ground, where it comes out and how much of the river it makes can be measured, and much of it has been.
Rock carried away
Every glass of Ozark spring water carries a little of the hills in it. Rain soaks into the ground as a very weak acid, eats at the dolomite along its cracks, and carries the calcium and magnesium away in solution, invisible in the clearest water. In samples taken from the lower Jacks Fork between 1994 and 1998, hardness, the measure of dissolved calcium and magnesium, ran from 140 to 180 milligrams per liter, counted as calcium carbonateMDC 2001, PDF 92–93 (table Wq02).. That is hard water by any ordinary standardwater of 121 to 180 milligrams per liter is classed as hard on the scale the U.S. Geological Survey uses; general., the kind that leaves soap reluctant to lather. The white scale that builds up in a teakettle filled from an Ozark well is made of the same minerals, coming back out of the water.
Big Spring on the Current River, which takes in water from the Jacks Fork country, shows the size of the process. The calcium and magnesium leaving the spring add up to about 1,950 cubic feet of dissolved dolomite every dayImes and others 2007; Thornberry-Ehrlich 2016, 18., a block of rock about twelve and a half feet on a sidethe cube root of 1,950.. Over a year that comes to a block nearly 90 feet on a sidethe cube root of 1,950 × 365.. The work goes on unseen under the hills, along the cracks the water can reach, and it widens those cracks into the passages that carry the water to the springs.
Losing streams
Most creeks gather water as they go, from groundwater seeping out of their banks and beds. That happens where the Water table. The level below which every crack and pore in the ground is full of water (Chapter 12; Chapter 13). Glossary →, the level below which the ground is full of water, stands higher than the creek bedgeneral explanation of gaining and losing streams., so that water runs downhill out of the ground into the channel. In karst country the water table often lies below the bed, and then the flow runs the other way. Many creeks lose water into their own beds. Missouri calls a stream losing when a significant share of its water, at least 30 percent in dry weather, goes underground into the bedrockMDNR, “Losing Streams.”. The water drops through gravel-filled Sinkhole. A hollow in the ground where rock below has dissolved or caved in, through which water drains underground; also called a sink, an American use (Chapter 2; Chapter 12). Glossary → in the channel or through cracks in the bed widened by solutionMugel, Richards and Schumacher 2009, 63.. In a wet spell a Losing stream. A creek that gives up its flow to the bedrock and runs dry for long stretches. Jam Up Creek, Pine Hollow and Johnny Hollow are the officially listed losing streams of the watershed (Chapter 12). Glossary → can run bank to bank like any other creek. In a dry spell it shrinks to a string of Pool. A deep, slow stretch of river between riffles (Chapter 16). Glossary →Imes and Fredrick 2002, “Dye Injection.” with dry gravel between them, and then to dry gravel.
Three streams in the Jacks Fork watershed are officially designated as losing: about five miles of Jam Up Creek, two miles of Pine Hollow in the Mahans Creek drainage and a mileMDC 2001, PDF 26 (table Ge01, after MDNR 1999). of Johnny Hollow near Rymers. The designation comes from state water rules written to protect streams below wastewater outfalls, and it covers only reaches that had been studied for that purpose. Many other streams in the watershed may lose large amountsMDC 2001, PDF 11 (“possibly lose”). of water underground without ever having been classified. Mapped from other records, the losing streams in the area that feeds Alley Spring alone run to about thirty-four miles, and those in the area that feeds Blue Spring to nearly sevenMugel, Richards and Schumacher 2009, 60–62 (table 9: 33.9 miles in Alley Spring’s recharge area and 6.8 in Blue Spring’s)..
Jam Up Creek is the clearest case. Its head runs through Mountain ViewJacks Fork Creek Network 2026 ; see Chapter 18., which sits on the broad, flat divide between the upper Jacks Fork and the Eleven PointMDC 2001, PDF 60., and from there the creek runs northeast toward the river. Below the town’s wastewater plant the creek normally loses all its surface flow within half a mile to a mile. On a July day in 2001, with about half a cubic foot a second running in the creek just below the plant, the flow was zero a mile downstream, and several large pools stood in the dry bed between, as they commonly do in Ozark losing streamsImes and Fredrick 2002, “Introduction” and “Dye Injection” (“a common occurrence in losing streams in the Ozarks”).. Farther down, water comes back into the creek before it reaches Jam Up Cave and the river (Chapter 13). It is different waterImes and Fredrick 2002, “Detection of Dye at Monitored Sites.”, as a Dye trace. A test of where underground water goes: a harmless fluorescent dye is put into a sinking stream or a sinkhole, and the springs are watched for it. Traces showed water lost from Jam Up Creek reaching Big Spring on the Current (Chapter 12). Glossary → showed that summer.
The river itself may lose water near its head. On August 14, 2006, the two Prong. A branch or arm of a creek, set down in 1860 as Southern usage. The North and South Prongs join to form the Jacks Fork (Chapter 18). Glossary → together carried about 29 cubic feet a second, and that evening the river near the VFW campground, a few miles below the junction, carried 23.6. Farther up, the North Prong was dry at the Route 137 crossing, and a second site on the South Prong found less than a cubic footMugel, Richards and Schumacher 2009, 28 (table 2: North Prong 13.5 and 0; South Prong 15.6 and 0.95), 19 (figure 9, which sets the North Prong’s 13.5 near its mouth and its dry site at Route 137); see Reach A. a second. The shortfall of about five and a half29.1 less 23.6. cubic feet a second is an apparent loss, and nobody has yet established whether it lies in the prongs or in the uppermost river. Each of the three main measurements was rated fair, meaning accurate to within about 8 percent, and in a gravel channel part of the flow moves through the streambedMugel, Richards and Schumacher 2009, 17 (fair, within about 8 percent; accuracy limited “where there is considerable flow through the gravel streambed, which cannot be measured”), 28 (table 2, sites 89–92 each rated fair)., where no current meter can measure it. Taken as a whole, the 2006 run found the rivers gaining water, and the water-table map drawn for the same study shows no losing conditionsMugel, Richards and Schumacher 2009, 34 (“In general, the seepage run showed gaining conditions”; fig. 7). along the Jacks Fork.
Sinkholes, the closed hollows in the uplands where rain has no way out but down, are the other open doors into the ground. How they form is told in Chapter 2. The area that feeds Alley Spring holds 312Mugel, Richards and Schumacher 2009, 59, 60–62 (table 9). mapped sinkholes, about two to the square mile, and the area that feeds Blue Spring holds 97. Together the sinkholes and their small drainage basins take in less than a tenthMugel, Richards and Schumacher 2009, 63. of the land in each Recharge area. The land that feeds a spring. It can reach under a ridge into a neighboring watershed, and its underground edge, the groundwater divide, can lie miles from the ridge that divides the streams on the surface (Chapter 12). Glossary →. Sinkhole maps in this country come largely from topographic maps drawn in twenty-foot stepsThornberry-Ehrlich 2016, 40., on which a shallow sink can hide between two contour lines, and an older count, from older data, gave densities a twentieth as high or lessMDC 2001, PDF 11 (about 10 sinkholes per 100 square miles at most, after Adamski and others 1995)..
Where the water comes out
All the water that goes down has to come out somewhere, and it comes out at springs. The large Ozark springs are the outlets of cave systemssee Chapter 13. that gather water from wide areas underground and bring it out at the foot of a valley (Chapter 13). The national riverways holds more than 400 known springsThornberry-Ehrlich 2016, 17.. Forty-eight springs in the Jacks Fork watershed appear on the topographic maps and in the published lists of Missouri springs, and field searches by the Park Service have found significantly moreMDC 2001, PDF 11 (from the topographic maps and Vineyard and Feder 1974).. Across the state more than 1,100 springs were on record by the early 1980sVineyard and Feder 1982, which gives data on 585 of them.. The big ones have always invited boasting. A book about the state published in 1904The State of Missouri (1904), 539, as quoted in Sauer 1920, 51. called the springs of Shannon, Oregon and the neighboring counties “probably the largest in the world,” and the greatest of them, Alley among them, have been called the Jewels of the OzarksThornberry-Ehrlich 2016, 17..
Hydrologists rank springs by size, in steps of ten. A first-magnitude spring averages at least 100 cubic feet a second, about 65 million gallons a day. A second-magnitude spring averages between 10 and 100 cubic feet a second, and a third-magnitude spring between 1 and 10the standard classification of springs by discharge, general.. The riverways has one of the largest collections of first-magnitude springs in the worldThornberry-Ehrlich 2016, 17; Mugel, Richards and Schumacher 2009, 2., and the Current, the Jacks Fork and the Eleven Point together have more of them than any other rivers in the countryWeary and others 2014, 7.. On the Jacks Fork there is one.
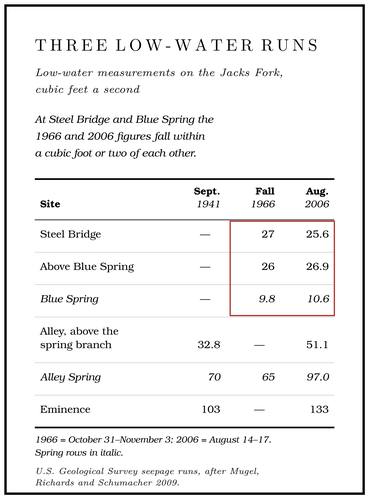
Alley Spring. A Gauge. A station of the Geological Survey that records the river’s stage, from which its flow is figured. The Jacks Fork has gauges at Highway 17, Alley and Eminence (Chapter 14). Glossary → stood on Alley Spring’s Branch. A small creek. The sense is American, on record from 1674 (Chapter 18). Glossary → from 1928 to 1939 and again from 1965 to 1979. Over those years the spring averaged 135 cubic feet a second, about 87 million gallons135 cubic feet a second × 646,317 gallons a day. a day, and the lowest flow recorded was 54 cubic feet a second in October 1934, in the great drought of the 1930s. That makes it the seventh-largest spring in Missouri and the third-largest in the Current River basin, behind Big Spring and WelchMugel, Richards and Schumacher 2009, 9, 32 (table 4), 43–44. Spring. Other published averages run lower, at about 125 cubic feet a second, the same as 81 million gallons a dayMDC 2001, PDF 11, PDF 27 (table Ge02, after Vineyard and Feder 1974), gives about 125 cubic feet a second; Thornberry-Ehrlich 2016, 17, and NPS 1977 give 81 million gallons a day, which is 125 cubic feet a second. (Chapter 13). Low-water measurements found 70 cubic feet a second in September 1941, 65 in the fall of 1966 and 97 in August 2006.
Alley Spring’s water rises from below. The round pool at the foot of the Bluff. A cliff along the river, usually on the outside of a bend, where the river has cut sideways into the hill. In this sense the word was first used in North America (Chapter 2; Chapter 18). Glossary → is the top of a flooded cave (Chapter 13; Reach H). Layers of sandstone in the rock above the cave barely dissolve and barely let water through, and they act as a lid on the cave system below. Water in the system is pressed on by the weight of water standing higher in the hills, and where the lid has been broken through, the water wells up into the pool from a lower cave passage. Hydrologists call this Artesian flow. Groundwater pressed upward by the weight of water standing higher in the hills, rising where a tight layer above it has been broken through. Alley Spring wells up this way into its pool (Chapter 12). Glossary →, and a pool fed from beneath this way a Rise pool. A spring pool fed from beneath, where the water wells up from a lower cave passage, as at Blue Spring (Chapter 12; Chapter 13). Glossary →Thornberry-Ehrlich 2016, 18–19 (fig. 14).. A water tower works on the same principle.
Blue Spring. The upper river’s spring comes out of a cave in the left-bank bluff below Steel Bridge (Reach D). It measured 9.8 cubic feet a second in the fall of 1966 and 10.6 in August 2006, close to seven million gallons10.6 × 646,317. a day. Small as it is beside Alley, it is the second-largest spring on the Jacks Fork, and in August 2006 it made up 27 percentMugel, Richards and Schumacher 2009, 32, 43, 47 (table 7). of the river just below it. Its average flow has only been estimated, at about 24.5 cubic feet a second, by scaling up its 1966 low flow by the ratio that holds at Round SpringMugel, Richards and Schumacher 2009, 43, 47 (table 7), after Aley 1976, who applied Round Spring’s ratio of annual mean to 1966 low flow, about 2.5. on the Current, which would make it a spring of the second Magnitude. The rank hydrologists give a spring by its average flow, in steps of ten. A first-magnitude spring averages at least 100 cubic feet a second, and a second-magnitude spring between 10 and 100 (Chapter 12). Glossary →.
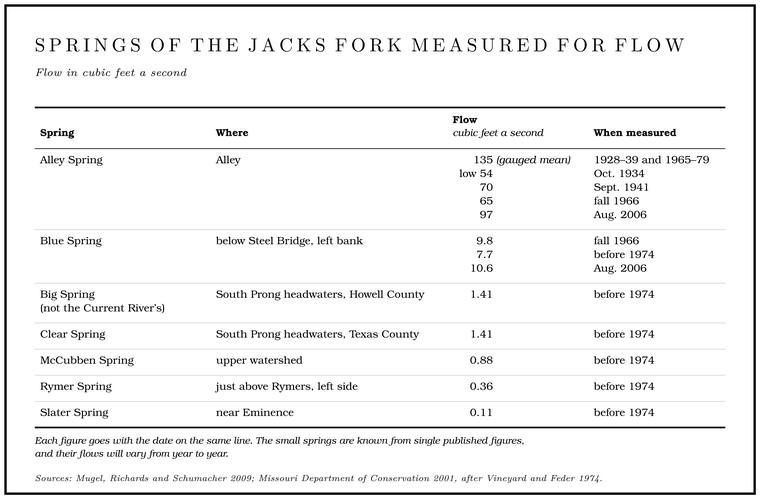
The small springs in the table are known from one or two published figures, and their flows will vary from year to year. Dozens of springs in the watershed have never been measured at all.
Cold water, blue water
Anyone who has put a hand into a Spring branch. The stream that runs from a spring to the river, such as the branch below Alley Spring (Reach H). Glossary → in July knows the water is cold. In measurements made over two days each summer from 2007 through 2009, the water of the park’s large springs held between about 13.5 and 14.5 degrees Celsius, roughly 56 to 58 degrees Fahrenheit, and hardly changed between day and night. At Alley the summer means ran from 13.6 to 13.9Bowles and others 2011, 8, 28, appendix B. degrees. Big Spring, measured every day from 2001 to 2004, stayed between about 13 and 15 degrees, and within any one year it generally varied by less than a degreeImes and others 2007..
The steadiness comes from the time the water spends in the rock. Some tens of feet downgeneral knowledge of ground temperature., the ground no longer feels summer and winter, and it settles near the average temperature of the year at the surface. Water that travels underground for weeks or years takes on that temperature and keeps it when it comes out. In July, 57 degrees feels cold. On a hard January morning the same water is far warmer than the air, and a spring branch steams. Below a large spring the river runs cooler in summer and warmer in winter than it would otherwise, and fish use the differencesee Chapter 16. (Chapter 16). The river at Steel Bridge, with little spring water to steady it, swings with the weathersee Reach D. (Reach D).
The same steady cold made the springs the iceboxes of the hills. Before rural electric linessee Chapter 13., a farm family with a spring usually kept a Springhouse. A small building over or beside a spring, where cream, milk, butter and meat were kept cool (Chapter 12). Glossary → over it or beside it for cream, milk, butter, meat and vegetablesVineyard and Feder 1982 (springs “once widely used as a means of refrigeration for rural families”; “Practically everyone had a springhouse where cream, meat, vegetables, and other products were stored”). (Chapter 13). At Alley the McCormacks are said to have kept their milk, butter and produce in a springhouse at McCormack SpringLewis 1980, PDF p. 55, the only source; see Reach H., and the hamlet’s own spring house stood until the state cleared it away in 1926–27see Chapter 10. (Chapter 10; Reach H).
The springs are also known for their color. A writer floating past Alley, probably in 1934Dorrance 1938, 34; for the year of the float, see Chapter 9., saw the spring stream go down the mill Chute. A narrow, fast slot of water through a shoal or past an obstacle. A smooth V of water pointing downstream marks the deepest path through it (Chapter 20). Glossary → “robin’s egg blue.” Water itself is faintly blue: its molecules absorb some of the red endUSGS, “Color and Water.” of sunlight, so the deeper and clearer the water, the bluer the light that comes back out of it. Spring water on an ordinary day is about as clear as natural water gets. In the summer measurements of 2007 to 2009 its turbidity, the measure of cloudiness, was normally less than 1 unitBowles and others 2011, 28., about the clarity of drinking water. The dissolved minerals, the depth of the pools and the blue of the sky all add to the shade. After a heavy rain, fine sediment flushed through the conduits can turn a spring milkyThornberry-Ehrlich 2016, 11, 17. for a time, until the plumbing clears.
Springs that ebb and flow
A few springs in the Ozarks run strongly for a while, slow to a trickle or stop, and then come back, over and over. People call them Ebb-and-flow spring. A spring that runs strongly, slows or stops, and comes back again, over and over, probably by the working of a natural siphon in the rock. Ebb and Flow Spring above Rymers is one (Chapter 12). Glossary →, and in 2002 eight were known in MissouriMissouri Geological Survey 2002.. They are rare everywhere. By the early 1980s only about 26 were known in the whole country. Of 23 known in 1944, five were in Missouri, and three moreVineyard and Feder 1982, 13. were found in the state afterward. By one count of about 1980, four of the country’s 26 were in Shannon County, and more were known locallyLewis 1980, PDF p. 30, the only source for the county count..
The Jacks Fork has at least one, and a spring at Chalk BluffLewis 1980, PDF p. 34, by one account; see Reach F. is said to ebb and flow as well (Reach F). Ebb and Flow Spring lies on the left, three-tenths of a mile above RymersMDC 2003, miles 15.9 and 16.2 (measured along the river centerline, Rymer Spring 16.21 and the Rymers landing 16.50).. It has drawn notice for a long time. During the geological mapping of the Eminence country, from September 14 to October 11, 1923, a seven-day water-stage recorder was kept on it, an instrument whose float moves a pen up and down on a paper chart turned by clockworkgeneral description of a float-type stage recorder., and the record was printed as a graph of its dischargeBridge 1930, 22 (the spring “on Upper Jacks Fork, is deserving of mention because of its peculiar periodic fluctuations”), and the figure on p. 51 (“Discharge record of Ebb and Flow spring on Jacks Fork, Shannon Co., Mo., Sept. 14 to Oct. 11, 1923. Record made with Gurley 7-day water stage recorder”). The report does not say who tended the recorder. That Bridge’s “Ebb and Flow spring on Jacks Fork” is the spring above Rymers rests on the name; his other Ebb and Flow spring, graphed in 1922, is the one on Thompson Creek.. A Park Service river folder of 1977NPS 1977. described it as attractive during “flow” but perhaps only a trickle during “ebb,” and said the intervals were “very irregular and not well understood, except that they probably bear some relation to local precipitation and its effect on the water table below ground.” The Shannon County Hunting and Fishing Club built its cabins near the spring after 1912see Chapter 9. (Chapter 9). Rymer Spring, across the river from Rymers and a little upstream, is also described as a small ebb-and-flow spring, and where it is described that way no separate Ebb and Flow Spring appears beside it. Ebb and Flow Spring and Rymer Spring are probably one spring known by both names. On the 1948 topographic map the spring lettered Ebb and Flow Spring stands about twenty meters from the recorded position of Rymer SpringUSGS 1948 (Summersville; the spring symbol lettered Ebb and Flow Spring); USGS GNIS (Rymer Spring); Lewis 1980, PDF p. 30 (“Rymer’s Ebb and Flow Spring”); see Reach E.. A Park Service proposal of 1960NPS 1960, 6. counted Rymer Spring the largest ebb-and-flow spring of the Current and Eleven Point country, with “a reported volume of 14 million gallons daily,” about 22 cubic feet a second14,000,000 ÷ 646,317.. The one published measurement of the spring, made before 1974, is 0.36MDC 2001, PDF 27 (table Ge02, after Vineyard and Feder 1974). cubic feet a second (Table 12.1), about a sixtieth0.36 ÷ 21.7. as much, and in the dry week of August 2006 the river near Jam Up Cave and the river near Rymer Spring carried within half a cubic foot a secondMugel, Richards and Schumacher 2009, 28 (table 2: 37.7 near Jam Up Cave, 38.2 near Rymer Spring). of each other (Table 12.3). A second Ebb and Flow Spring, on Thompson CreekSchaper 2018, 1–3 (“a small ebb and flow spring”). just up the Current from Two Rivers, is a different spring.
The usual explanation for such springs, offered as early as 1724 by the natural philosopher J. T. Desaguliers, is a natural siphon. A siphon works like a garden hose run from a full bucket over the rim and down below the bucket’s Bottom. The flat land along a river or creek, built of its deposits and open to its floods. In the 1920s the bottoms near Eminence averaged about a quarter of a mile wide (Chapter 2; Chapter 5). Glossary →: once the hose is full, water keeps flowing up over the rim, pulled by the weight of the water in the long downward leg, until air gets in and the flow stops. Underground, the bucket is a chamber in the rock that fills slowly from cracks, and the hose is an outlet passage that climbs over a hump before it falls to the spring. While the chamber fills, the spring runs low. When the water reaches the top of the hump it spills over, fills the downward leg and starts the siphon, which drains the chamber much faster than the cracks can refill it, and the spring surges. When the chamber is drawn down to the inlet of the passage, air rushes in, the siphon breaksXiao and Zhang 2021, 109–11. and the spring falls back. Siphons have since been found in real spring systems, where they seem to belong to a Stage. The height of the water surface above a gauge’s datum, the reading a gauge records. A stage differs from the depth of the water. At Eminence the datum stands 616.18 feet above sea level (Chapter 14). Glossary → between passages still full of water and caves already drained and full of airVineyard and Feder 1982, 13..
Laboratory models built to test the idea show why the rhythm wanders. Whether the spring stops between pulses, keeps flowing at a low rate or runs steadily depends on how fast the hidden chamber is refilled, and that depends on how much rain has fallen. Above a certain rate of recharge the spring behaves like an ordinary springXiao and Zhang 2021, 116–19.. No one has studied the plumbing of the spring above Rymers closely enough to say what lies behind it, but a stage record of Rymer Spring shows the same rule at work in the field: both above and below certain flows, the spring does not ebb and flow at all. Each of Missouri’s recorded ebb-and-flow springs seems to keep a pattern of its ownVineyard and Feder 1982, 13, fig. 7 and text (“both above and below certain discharges the spring does not ebb and flow”; “each ebb-and-flow spring has its own pattern of fluctuations”)..
Following the water
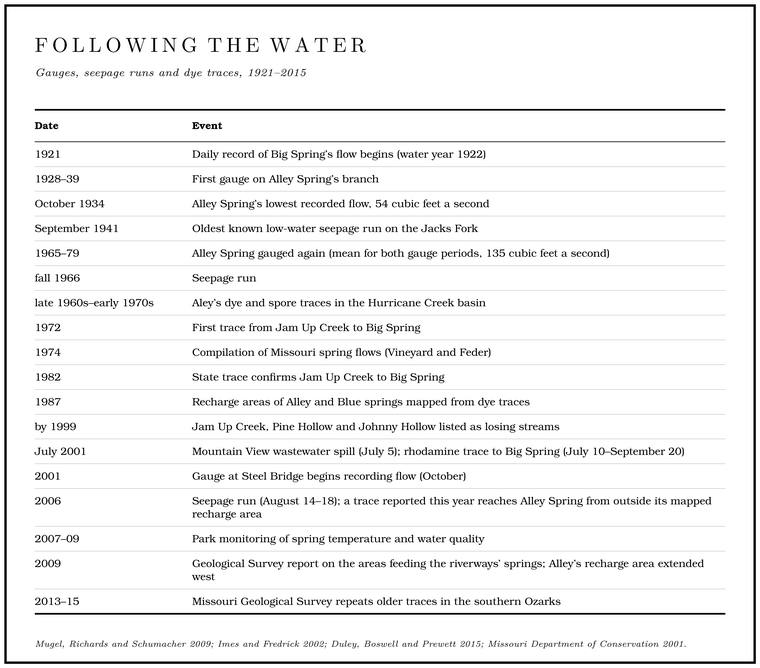
Water underground cannot be watched, so hydrologists mark it and wait to see where the mark comes out. Early tracers in Missouri used feathers and wheat chaff, with doubtful results. Floods sometimes ran the experiment on their own. Cornstalks are said to have come out of Blue Spring after a gully washer when no cornLewis 1980, PDF p. 23, the only source; see Reach D. was growing anywhere near it (Reach D). From 1966 to 1973 a Forest Service watershed study on Hurricane Creek south of WinonaAley 2000; the study was directed by the hydrologist Tom Aley. used fluorescein dye and the sporesSchaper, “Big Spring.” of club mosslycopodium, in Schaper’s account.. Modern traces use nontoxic fluorescent dyesMDNR, “Missouri Water Tracing Laboratory.”, usually in amounts too small for the water ever to look colored.
A few pounds of dye go into a sinkhole or a losing stream. At every spring, well and creek where the water might come out, the tracers stake packets of activated charcoal, the material in household water filters, sewn into bags of nylon window screenDuley, Boswell and Prewett 2015, 87.. The charcoal soaks up dye from the passing water and holds it, so a packet left for a week or twoImes and Fredrick 2002, “Dye-Detection Methods” (packets replaced at one- to two-week intervals). keeps a record of anything that went by. In the laboratory the charcoal is dried for a day and then soaked for four to six hours in a mixture of alcohol and ammonia, which Draw. A valley, in the usage of the Eleven Point side of the divide in Howell County (Chapter 18). Glossary → the dye back out. The solution goes into an instrument that shines light through it and measures how it glows. Each dye glows at its own wavelength. Rhodamine WT, a red dye common in traces, peaked at about 576 nanometers in the Geological Survey’s instrument, in the yellow part of the spectrumgeneral.. Bottles of water taken at the likely outlets, often by automatic samplersImes and Fredrick 2002, “Dye-Detection Methods” (90 percent isopropyl alcohol and 10 percent ammonium hydroxide)., give a closer record of when the dye arrived and how much.
Tracing has its limits. Dye sticks to clay and rock, breaks down, and lingers in slow corners of the plumbing, and even a successful trace rarely, if ever, recovers all of the dye. Natural compounds that glow can mask the dye or be mistaken for it, and the charcoal gathers those compoundsImes and Fredrick 2002, “Dye-Detection Methods” and “Quantification of Recovered Dye.” along with the dye. For decades most detection was done by eye, by looking at the washed-out solution. When the Missouri Geological Survey repeated a number of older traces in the southern Ozarks in 2013 to 2015, some confirmed the earlier results, some found outlets the earlier tracers had missed, and some did not agree with the earlier traces at all. Some of the earlier positive results may have been mistakenDuley, Boswell and Prewett 2015, 85–88, 90 (table 1), whose authors concluded that some past investigators “may have reported positive recoveries of dye erroneously.”. The state published revised recharge maps for Big Spring and about twenty other springs of the southern Ozarks in 2017, and Alley and Welch springs were not among themDuley and Boswell 2017 (spring groups A–J, mostly in Oregon and Ozark counties, with Mammoth Spring in Arkansas and Big Spring in Carter County; field work from August 2013; legacy traces repeated where they conflicted with water-level data, rested on visual detection or a single recovery, or lacked background data).. A trace shows where water goes in and where it comes out, but never the route it takes betweenWeary and others 2014, 7 (dye traces are “incapable of revealing actual flow paths”).. Every water trace in Missouri must now be registered with the state, which keeps the results and helps prevent one trace from overlappingMDNR, “Missouri Water Tracing Laboratory” (section 256.621, RSMo). another.
Jam Up Creek goes to Big Spring
The best-known trace in the Jacks Fork country began in Jam Up Creek. A trace in 1972 had shown that water lost from the creek below Mountain View came out at Big Spring on the Current River, and a state trace in 1982 found the same. The third trace was made for a practical reason. On July 5, 2001, about 50,000 gallons of partly treated wastewater spilled from the Mountain View treatment plant into Jam Up Creek (Chapter 17), and the Park Service wanted to know when it would reach Big Spring and what it would doImes and Fredrick 2002, “Introduction.” to the water there.
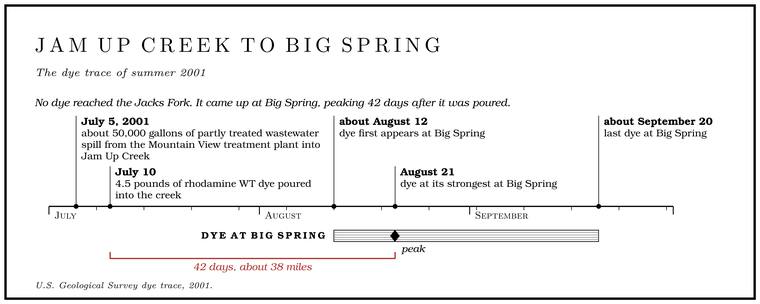
On July 10 hydrologists from the Geological Survey poured 4.5 pounds of rhodamine WT dye into the small flow of the creek about 1,200 feet below the plant. They watched four places: Jam Up Creek at Jam Up Cave, the Jacks Fork at the mouth of the creek, the Jacks Fork at Rymers Landing and Big Spring. The first three lay 7.5, 7.6 and 11.2 stream miles below the plant. From July 21 an automatic sampler at Big Spring took a bottle of water every twelve hoursImes and Fredrick 2002, “Dye Injection and Recovery Procedures.”.
No dye reached Jam Up Cave, the mouth of the creek or Rymers. None of the water lost from the upper creek came back into the lower creek or into the Jacks Fork. The dye surfaced at Big Spring, first about August 12, at its strongest on August 21 and last about September 20. At the peak it had traveled about thirty-eight miles in forty-two days, a little under a mile a day. Earlier traces had suggested thirty-five to Forty. Forty acres, a quarter of a quarter section. A hill farm was often one or two forties (Chapter 5). Glossary → days. Another trace to Big Spring, counted in 2000 as the longest groundwater trace in the country, began in a losing stretch of the Eleven Point River 39.5 miles from the spring, and its dye first appeared there sixteen daysAley 2000. MDC, “Big Spring,” gives the same distance and time for a trace from “a losing stream” near Mountain View without naming the stream; it is not the Jam Up Creek trace. later. Water reaches Big Spring from as far as fifty milesThornberry-Ehrlich 2016, 18. away. The speed surely depends on how much water is moving through the system, and that summer the spring ran between 244 and 342 cubic feet a secondImes and Fredrick 2002, “Quantification of Recovered Dye at Big Spring.” as rains came and went. About 17 percent of the dye came back at Big Spring, some three-quarters of a pound of the four and a half poured in, and at its peak the spring’s water held 0.028 micrograms of it per liter, far too little to see. That August state investigators sampled fifty-four private wells near the plant and found the dye in one, about 1.7 miles eastImes and Fredrick 2002, “Introduction,” “Detection of Dye at Monitored Sites,” “Quantification of Recovered Dye at Big Spring” and “Dye Injection” (0.77 pound recovered). of it.
On a map the trip makes little sense. Mountain View’s creek drains northeast on the surface to the Jacks Fork. The water that sinks into its bed goes southeast under the hills, beneath country whose creeks drain the other way, and comes up in the Current below Van Buren, well downstream of the place where the Jacks Fork joins the Current. The surface route would run the length of Jam Up Creek, most of the Jacks Fork and a long stretch of the Current. In a straight line the distance is about thirty-eight milesImes and Fredrick 2002, “Introduction” and fig. 1; MDC 2001, PDF 11.; the route the water takes underground is unknown.
Big Spring, one of the largest karst springs in the world, pours about 288 million gallons a day into the Current. Its flow has been gauged since the early 1920s. Early in the twentieth century it was credited with 223 million gallons a day and a stream a hundred feet wideSauer 1920, 51, citing E. M. Shepard’s U.S. Geological Survey Water-Supply Papers of 1904–07; the figure predates the gauge.. In flood it has run at about 800 million gallons a dayThornberry-Ehrlich 2016, 17 (peak flow)., and its highest flow in the record kept to the early 1970s, about 1,300 cubic feet a second by estimateVineyard and Feder 1982, 12, tables 1–2 (maximum about 840,000,000 gallons a day in June 1928; 1,300 cubic feet a second, estimated)., some 840 million gallons a day, came in June 1928, the month of a great flood on the Jacks Forksee Chapter 14. (Chapter 14). The land that feeds it is estimated at 426 square miles, nearly the size of the Jacks Fork’s whole watershed, and its water has been traced from as far as fifty milesThornberry-Ehrlich 2016, 17–18. away. Some of its water is days or weeks old, rain rushing through the large conduits. The steady base of its flow, the water that keeps it running through a drought, is much older: chemical tracers put its average age at roughly 30 to 200 yearsImes and others 2007..
Two watersheds
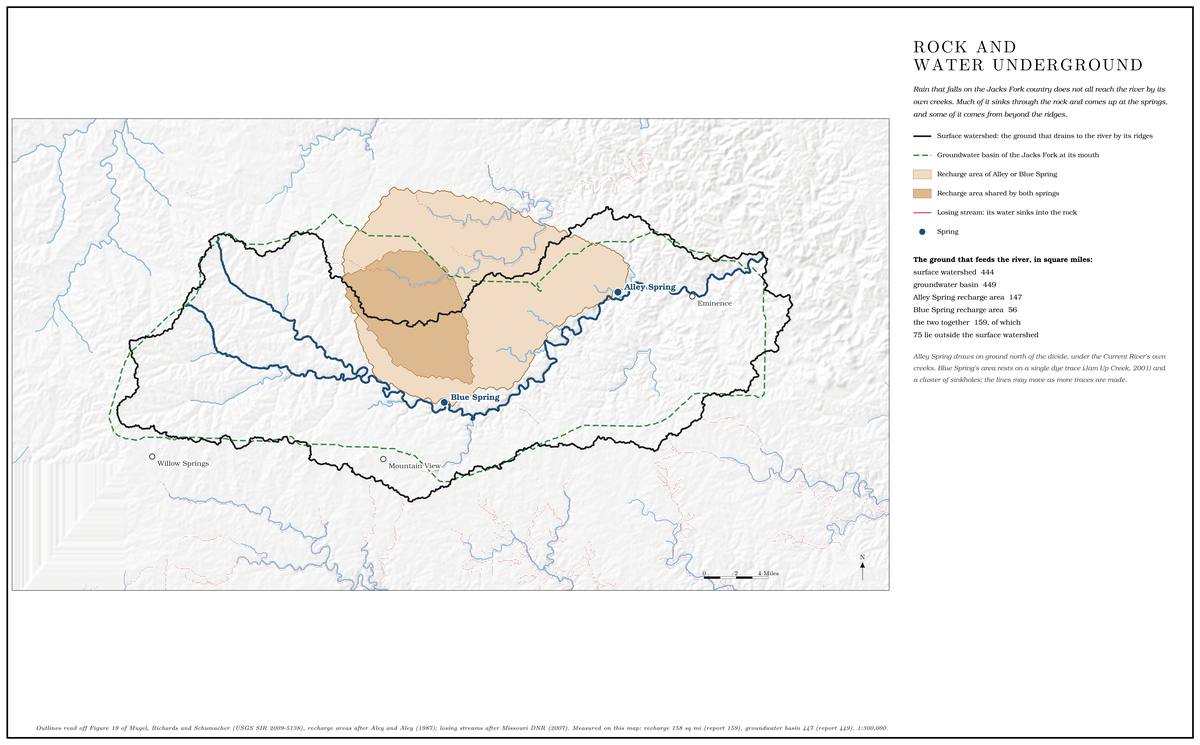
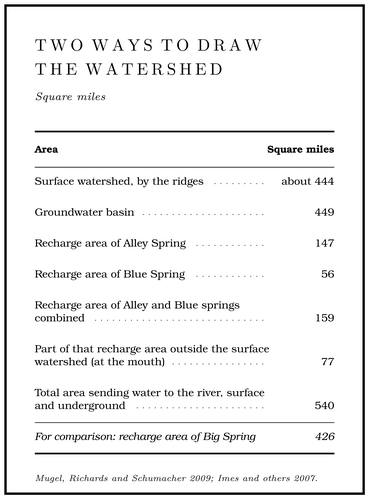
Every map of rivers is drawn along the high ground. Rain on one side of a ridge runs to one creek and rain on the other side to another, and the line along the ridgetops is the surface divide. By that measure the Jacks Fork’s watershed covers about 444 square milesMugel, Richards and Schumacher 2009, 48 (table 8)..
In karst country the surface divide is only part of the picture. Water that soaks into the ground follows the plumbing, which pays no attention to the ridges. The land that feeds a spring, its recharge area, can reach under a ridge into a neighboring watershed, and its underground edge, the groundwater divide, can lie miles from the surface one. Dye traces by the Forest Service and the state in the 1970s and 1980s showed groundwater in the Jacks Fork country moving generally southeast, and showed the Jacks Fork both losing water to the Current’s side and takingMDC 2001, PDF 11. water from it. Across the region the traces cross one another, overlap, and run long distances, and the losing and gaining streams add to the tangle, so that underground the water follows the lines of its creeks on the surface hardly at allWeary and others 2014, 7, 14–15 (“little consistency between surface-water flow and groundwater flow”)..
Jam Up Creek shows one direction of the trade. The big springs show the other. As drawn from the traces, Alley Spring’s recharge area covers about 147 square miles and Blue Spring’s about 56. Most of Blue Spring’s area lies inside Alley’s, and together they cover about 159 square miles, 51 percent of it outside the surface watershed above Alley. A trace reported in 2006 came up in Alley Spring from a point outside the old boundary, and the boundary was later moved westMugel, Richards and Schumacher 2009, 43–45, after Aley and Moss 2006b. to take it in. In all, the land that sends water to the Jacks Fork, on the surface or underground, covers about 540 square miles. In a dry season, when nearly all the river is spring water, about 37 percent of the water passing the mouth probably fell as rain outside its surface watershed. The figure comes from two others. In August 2006 Blue and Alley springs together put out 108 cubic feet a second, 78 percent of the flow measured at the mouth the next day. Of their combined recharge area, 48 percentMugel, Richards and Schumacher 2009, 46, 48 (table 8). lies outside the surface watershed of the whole river, and 48 percent of 78 percent is about 37.
A rough rule among Ozark hydrologists gives a spring about a square mile of recharge for every cubic foot a second it averages. A cubic foot a second, kept up for a year, is about 13½ inchesa cubic foot a second for a year over a square mile, computed. of water spread over a square mile, a little under a third of the 45 inches or so of rainThornberry-Ehrlich 2016, 36 (45 inches a year at Eminence). that falls on this country in a year, and most of the rest goes back into the airgeneral. from leaves and soil. Alley Spring fits the rule closely, with 147 square miles for a mean flow of 135. Blue Spring’s 56 square miles are more than twice what its estimated 24.5 would call for, because most of that ground is shared with Alley’sMugel, Richards and Schumacher 2009, 43, 47 (table 7: 1.09 and 2.29 square miles per cubic foot a second of annual mean), after Aley..
These boundaries are estimates, and some are thin. Blue Spring’s recharge area rests on a single successful dye trace and a cluster of sinkholes north-northeastMugel, Richards and Schumacher 2009, 43. of the spring. In 2015 Alley and Welch springs were next in line for the state’s tracing work, and the lines on the map may moveThornberry-Ehrlich 2016, 45. as those results come in.
The river in a dry week
The 2006 measurements are what hydrologists call a Seepage run. Measurements of a river and every tributary within a few days of a dry spell, to find where water enters and leaves. The Jacks Fork was measured this way in 1966 and 2006 (Chapter 12). Glossary →. In a long dry spell, while the flow is changing little, the river and every tributary are measured within a few days. The arithmetic is a household budgetgeneral explanation of a seepage run.. The flow at each point on the river should equal the flow at the point above it plus whatever the creeks and springs between them added. Where the river gains more than its creeks put in, water must be coming up from below; where it gains less, water is going down. Each measurement is made by wading. The crew stretches a tape across the stream and divides it into a row of narrow strips, and in each strip a current meter, a small wheel of cups or a propeller on a wading rod, counts how fast the water is moving while the rod gives the depth. Width times depth times speedgeneral explanation of the standard current-meter method of the U.S. Geological Survey. gives the water passing through each strip, and the strips added together give the flow of the stream. The crews made 255 measurements and observations on the Current, the Jacks Fork and Sinking Creek between August 14 and 18Mugel, Richards and Schumacher 2009, 17.. Rain had fallen three days before the run and again on its first day, two-thirds of an inch and then nearly half an inchMugel, Richards and Schumacher 2009, 30. at Eminence. Table 12.3 gives a selection of the Jacks Fork numbers.
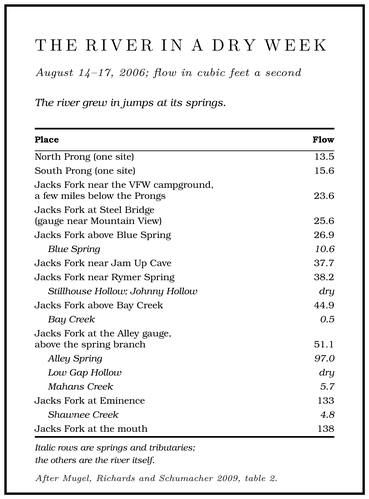
Italic rows are springs and tributaries; the others are the river itself.
Read down the table and the river’s structure appears. From the Prongs to Steel Bridge the river does not grow at all, and it may shrink. Blue Spring adds more water in one place than the river had gained in all the miles above it. Between Jam Up and Alley, with nearly every hollow dry, the river picks up a few cubic feet a second here and there from small springs and seeps along the bluffs. Then Alley Spring nearly triplesMugel, Richards and Schumacher 2009, 28 (table 2: 51.1 above the spring branch, 137 below it), 47 (table 7). it. That week Alley Spring was 71 percent of the river just below it, and counting the spring-fed prongs, nearly all the river’s flow at Alley was spring waterMugel, Richards and Schumacher 2009, 44–45, 47 (“Approximately 100 percent”).. Across the riverways as a whole, as much as 90 percentThornberry-Ehrlich 2016, 11. of the flow of the rivers comes from springs. The seven largest springs alone were found, from a seepage run of 1966 and the spring measurements that followed it, to supply about 60 percent of the Base flow. The flow that keeps a river running between rains. On the Jacks Fork most of it comes from springs (Chapter 12). Glossary →Barks 1978, 6 (from the 1966 seepage run and later spring measurements). of the Current and the Jacks Fork.
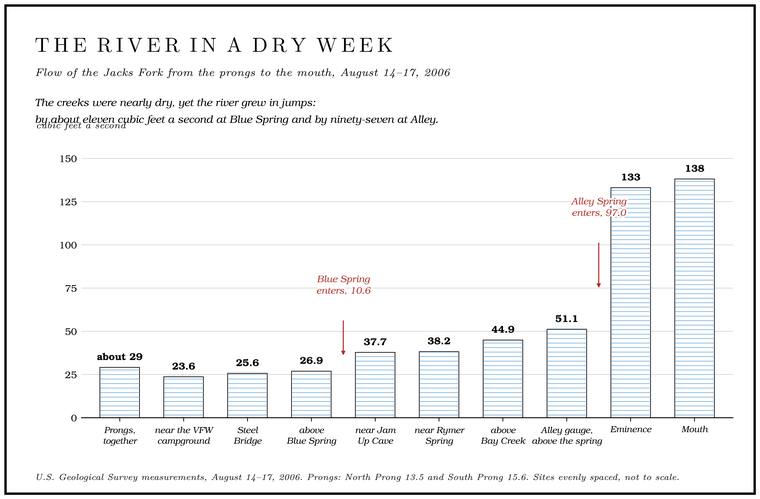
The same measurements show how far a dry August sits below an ordinary day. The average flow at Steel Bridge is about 200 cubic feet a second, so the 25.6 measured in 2006 was about an eighth of it. At Eminence the 133 measured that week was 29 percent of the mean. The springs held up better than the river around them. Alley’s 97 was 72 percentMugel, Richards and Schumacher 2009, 32 (table 4). of its long-term mean, and Blue Spring’s 10.6 was about 43 percentMugel, Richards and Schumacher 2009, 47 (table 7). of its estimated one.
The low-water record is older than the gauges on the upper river. An earlier seepage run, from October 31 to November 3, 1966, found 27 cubic feet a second at Steel Bridge, 26 above Blue Spring and 9.8 in the spring itself, within a cubic foot or two of the 2006 figures. A run of eleven measurements in September 1941 is the oldest known low-water profile of the river, and it found 32.8 cubic feet a second at Alley above the spring branch, 70 in the spring and 103Mugel, Richards and Schumacher 2009, 9, 32 (table 4). at Eminence. A Mountain View resident who has floated the upper river since the 1970s believes that its springs and creeks run lower than they used toJacks Fork Oral History, record SV-20.. The spot measurements of 1966 and 2006 at Steel Bridge and Blue Spring show low flow there nearly unchanged over those forty years, though two dry weeks forty years apart say nothing about the years since (Chapters 14 and 15).
Fast water and slow water
The basement does two jobs at once. Part of the water moves fast. Missouri’s thunderstorms push water into the ground in slugs, through sinkholes, losing streams and less obvious openings on hillsides and uplands, and it races through the big conduits. Hydrologists call water that goes in through a definite opening of that kind discrete recharge, and water that soaks in slowly through the soil diffuse recharge. Estimates made for the Hurricane Creek basin are the usual guide: about 63 percent of the water reaching the springs entered by direct routes, 10 percent through sinkholes, 11 percent through losing streams and 42 percent through other openings, and only about 37 percentMugel, Richards and Schumacher 2009, 59, after Aley. soaked in slowly through the soil. Groundwater in the riverways has been measured moving as fast as three miles a day. Water traveling that way is hardly filteredThornberry-Ehrlich 2016, 43. at all, which is why a spring can turn cloudy soon after a hard rain upland, and why something poured into a sinkhole can reach a spring miles away within days. The big springs answer a hard rain within hours, almost as fast as the creeksBarks 1978, 6 (the large springs “respond to intense rainfall within hours, almost as quickly as nearby streams”). around them.
Part of the water moves slowly, through countless small cracks and pores in the rock, and stays underground for years or generations. That old water is the base of the springs’ flow and the reason they keep running in a drought.
The same body of water serves the wells. Every formation from the Potosi Dolomite up through the Jefferson City and Cotter belongs to one great water-bearing body of rock, the Ozark Aquifer. A body of rock that holds groundwater and lets it move. Every formation from the Potosi Dolomite up through the Jefferson City and Cotter belongs to one great water-bearing body, the Ozark aquifer (Chapter 12). Glossary →, which reaches from the tight Cambrian beds buried below the Potosi up to the ground surface. It is unconfined, with no watertight layer above it to seal it off from the rain. It supplies most of the household wells of southeastern MissouriWeary and others 2014, 14., provides nearly 42 percent of the state’s usable groundwater, and feeds the springsThornberry-Ehrlich 2016, 43 (the aquifer “extends from the buried Cambrian confining unit below the Potosi Dolomite” to the surface). of the riverways. A well in the hills above Alley and Alley Spring itself draw from the same rock. The park’s own wells show how far down it goes. A well drilled at Alley in 1933, the year a Civilian Conservation Corps campsee Reach H. was set up there (Reach H), went 434 feet into the Eminence Dolomite. The newest, drilled in 1970 and probably the new well that was to replace the older onesBarks 1978, 11–12 (at each area “a new well … which will replace the old wells and become the primary water supplies”); that the 1970 well is the new one at Alley is inferred, since it is the newest of the three Alley wells in the table. as the area’s main supply, went down 650 feet, with casing in the top 301 feet, which seals the Hole. Any pool deep enough to swim or fish in, named or not, the basic unit of the river in local speech; also “hole of water” (Chapter 18). Glossary → offgeneral. from the broken rock near the surface so that water seeping down from above cannot run straight into it. Upriver, a well drilled at Cardinal Acres in 1957 went 106 feet down into the lower Gasconade, and one drilled at the Bunker Hill ranch in 1962 went to 330 feetBarks 1978, 11 (table 1: the Alley Spring maintenance-building well, 434 feet, cased 306; the Alley Spring well of 1970, 650 feet, cased 301; Cardinal Acres, 106 feet, 1957; Bunker Hill Ranch, 330 feet, 1962, both open to the lower Gasconade). in the same rock.
Both kinds of water matter to the river. The slow water keeps it running in August, and the fast water carries whatever lies on the land into it with very little cleaning on the way. Of all the large springs of the riverways, Blue Spring and Alley Spring have recharge areas with some of the most open land and the least forestMugel, Richards and Schumacher 2009, 1; Thornberry-Ehrlich 2016, 44.. Blue Spring’s 56 square miles are about half open land, mostly pasture, with less than half a square mile in public hands. Alley’s 147 square miles are about two-fifths open, with about 31 square miles of public land, and they hold about 1,800 people, some 200 certified wells and more than 180 milesMugel, Richards and Schumacher 2009, 60–62 (table 9). of state and county roads. What that means for the water, and what has been done about it, is the subject of Chapter 17.
The law has been slow to follow the plumbing. Missouri is a riparianthe Missouri Department of Natural Resources, quoted in Mittelhauser 2025, 199. state, and its natural resources department has taken the position that Missouri “does not have a need to regulate water usage.” A large well in the recharge area of a big spring could in principle reduce the spring’s flowMittelhauser 2025, 209–10, the only source., and Missouri law does little to prevent it.